Recherche avancée
Médias (91)
-

GetID3 - Boutons supplémentaires
9 avril 2013, par
Mis à jour : Avril 2013
Langue : français
Type : Image
-

Core Media Video
4 avril 2013, par
Mis à jour : Juin 2013
Langue : français
Type : Video
-

The pirate bay depuis la Belgique
1er avril 2013, par
Mis à jour : Avril 2013
Langue : français
Type : Image
-

Bug de détection d’ogg
22 mars 2013, par
Mis à jour : Avril 2013
Langue : français
Type : Video
-

Exemple de boutons d’action pour une collection collaborative
27 février 2013, par
Mis à jour : Mars 2013
Langue : français
Type : Image
-

Exemple de boutons d’action pour une collection personnelle
27 février 2013, par
Mis à jour : Février 2013
Langue : English
Type : Image
Autres articles (12)
-
Submit bugs and patches
13 avril 2011Unfortunately a software is never perfect.
If you think you have found a bug, report it using our ticket system. Please to help us to fix it by providing the following information : the browser you are using, including the exact version as precise an explanation as possible of the problem if possible, the steps taken resulting in the problem a link to the site / page in question
If you think you have solved the bug, fill in a ticket and attach to it a corrective patch.
You may also (...) -
Selection of projects using MediaSPIP
2 mai 2011, parThe examples below are representative elements of MediaSPIP specific uses for specific projects.
MediaSPIP farm @ Infini
The non profit organizationInfini develops hospitality activities, internet access point, training, realizing innovative projects in the field of information and communication technologies and Communication, and hosting of websites. It plays a unique and prominent role in the Brest (France) area, at the national level, among the half-dozen such association. Its members (...) -
Les formats acceptés
28 janvier 2010, parLes commandes suivantes permettent d’avoir des informations sur les formats et codecs gérés par l’installation local de ffmpeg :
ffmpeg -codecs ffmpeg -formats
Les format videos acceptés en entrée
Cette liste est non exhaustive, elle met en exergue les principaux formats utilisés : h264 : H.264 / AVC / MPEG-4 AVC / MPEG-4 part 10 m4v : raw MPEG-4 video format flv : Flash Video (FLV) / Sorenson Spark / Sorenson H.263 Theora wmv :
Les formats vidéos de sortie possibles
Dans un premier temps on (...)
Sur d’autres sites (3713)
-
Revision 30147 : corrections orthographiques
24 juillet 2009, par denisb@… — Logcorrections orthographiques
-
Open Media Developers Track at OVC 2011
11 octobre 2011, par silviaThe Open Video Conference that took place on 10-12 September was so overwhelming, I’ve still not been able to catch my breath ! It was a dense three days for me, even though I only focused on the technology sessions of the conference and utterly missed out on all the policy and content discussions.
Roughly 60 people participated in the Open Media Software (OMS) developers track. This was an amazing group of people capable and willing to shape the future of video technology on the Web :
- HTML5 video developers from Apple, Google, Opera, and Mozilla (though we missed the NZ folks),
- codec developers from WebM, Xiph, and MPEG,
- Web video developers from YouTube, JWPlayer, Kaltura, VideoJS, PopcornJS, etc.,
- content publishers from Wikipedia, Internet Archive, YouTube, Netflix, etc.,
- open source tool developers from FFmpeg, gstreamer, flumotion, VideoLAN, PiTiVi, etc,
- and many more.
To provide a summary of all the discussions would be impossible, so I just want to share the key take-aways that I had from the main sessions.
WebRTC : Realtime Communications and HTML5
Tim Terriberry (Mozilla), Serge Lachapelle (Google) and Ethan Hugg (CISCO) moderated this session together (slides). There are activities both at the W3C and at IETF – the ones at IETF are supposed to focus on protocols, while the W3C ones on HTML5 extensions.
The current proposal of a PeerConnection API has been implemented in WebKit/Chrome as open source. It is expected that Firefox will have an add-on by Q1 next year. It enables video conferencing, including media capture, media encoding, signal processing (echo cancellation etc), secure transmission, and a data stream exchange.
Current discussions are around the signalling protocol and whether SIP needs to be required by the standard. Further, the codec question is under discussion with a question whether to mandate VP8 and Opus, since transcoding gateways are not desirable. Another question is how to measure the quality of the connection and how to report errors so as to allow adaptation.
What always amazes me around RTC is the sheer number of specialised protocols that seem to be required to implement this. WebRTC does not disappoint : in fact, the question was asked whether there could be a lighter alternative than to re-use dozens of years of protocol development – is it over-engineered ? Can desktop players connect to a WebRTC session ?
We are already in a second or third revision of this part of the HTML5 specification and yet it seems the requirements are still being collected. I’m quietly confident that everything is done to make the lives of the Web developer easier, but it sure looks like a huge task.
The Missing Link : Flash to HTML5
Zohar Babin (Kaltura) and myself moderated this session and I must admit that this session was the biggest eye-opener for me amongst all the sessions. There was a large number of Flash developers present in the room and that was great, because sometimes we just don’t listen enough to lessons learnt in the past.
This session gave me one of those aha-moments : it the form of the Flash appendBytes() API function.
The appendBytes() function allows a Flash developer to take a byteArray out of a connected video resource and do something with it – such as feed it to a video for display. When I heard that Web developers want that functionality for JavaScript and the video element, too, I instinctively rejected the idea wondering why on earth would a Web developer want to touch encoded video bytes – why not leave that to the browser.
But as it turns out, this is actually a really powerful enabler of functionality. For example, you can use it to :
- display mid-roll video ads as part of the same video element,
- sequence playlists of videos into the same video element,
- implement DVR functionality (high-speed seeking),
- do mash-ups,
- do video editing,
- adaptive streaming.
This totally blew my mind and I am now completely supportive of having such a function in HTML5. Together with media fragment URIs you could even leave all the header download management for resources to the Web browser and just request time ranges from a video through an appendBytes() function. This would be easier on the Web developer than having to deal with byte ranges and making sure that appropriate decoding pipelines are set up.
Standards for Video Accessibility
Philip Jagenstedt (Opera) and myself moderated this session. We focused on the HTML5 track element and the WebVTT file format. Many issues were identified that will still require work.
One particular topic was to find a standard means of rendering the UI for caption, subtitle, und description selection. For example, what icons should be used to indicate that subtitles or captions are available. While this is not part of the HTML5 specification, it’s still important to get this right across browsers since otherwise users will get confused with diverging interfaces.
Chaptering was discussed and a particular need to allow URLs to directly point at chapters was expressed. I suggested the use of named Media Fragment URLs.
The use of WebVTT for descriptions for the blind was also discussed. A suggestion was made to use the voice tag <v> to allow for “styling” (i.e. selection) of the screen reader voice.
Finally, multitrack audio or video resources were also discussed and the @mediagroup attribute was explained. A question about how to identify the language used in different alternative dubs was asked. This is an issue because @srclang is not on audio or video, only on text, so it’s a missing feature for the multitrack API.
Beyond this session, there was also a breakout session on WebVTT and the track element. As a consequence, a number of bugs were registered in the W3C bug tracker.
WebM : Testing, Metrics and New features
This session was moderated by John Luther and John Koleszar, both of the WebM Project. They started off with a presentation on current work on WebM, which includes quality testing and improvements, and encoder speed improvement. Then they moved on to questions about how to involve the community more.
The community criticised that communication of what is happening around WebM is very scarce. More sharing of information was requested, including a move to using open Google+ hangouts instead of Google internal video conferences. More use of the public bug tracker can also help include the community better.
Another pain point of the community was that code is introduced and removed without much feedback. It was requested to introduce a peer review process. Also it was requested that example code snippets are published when new features are announced so others can replicate the claims.
This all indicates to me that the WebM project is increasingly more open, but that there is still a lot to learn.
Standards for HTTP Adaptive Streaming
This session was moderated by Frank Galligan and Aaron Colwell (Google), and Mark Watson (Netflix).
Mark started off by giving us an introduction to MPEG DASH, the MPEG file format for HTTP adaptive streaming. MPEG has just finalized the format and he was able to show us some examples. DASH is XML-based and thus rather verbose. It is covering all eventualities of what parameters could be switched during transmissions, which makes it very broad. These include trick modes e.g. for fast forwarding, 3D, multi-view and multitrack content.
MPEG have defined profiles – one for live streaming which requires chunking of the files on the server, and one for on-demand which requires keyframe alignment of the files. There are clear specifications for how to do these with MPEG. Such profiles would need to be created for WebM and Ogg Theora, too, to make DASH universally applicable.
Further, the Web case needs a more restrictive adaptation approach, since the video element’s API is already accounting for some of the features that DASH provides for desktop applications. So, a Web-specific profile of DASH would be required.
Then Aaron introduced us to the MediaSource API and in particular the webkitSourceAppend() extension that he has been experimenting with. It is essentially an implementation of the appendBytes() function of Flash, which the Web developers had been asking for just a few sessions earlier. This was likely the biggest announcement of OVC, alas a quiet and technically-focused one.
Aaron explained that he had been trying to find a way to implement HTTP adaptive streaming into WebKit in a way in which it could be standardised. While doing so, he also came across other requirements around such chunked video handling, in particular around dynamic ad insertion, live streaming, DVR functionality (fast forward), constraint video editing, and mashups. While trying to sort out all these requirements, it became clear that it would be very difficult to implement strategies for stream switching, buffering and delivery of video chunks into the browser when so many different and likely contradictory requirements exist. Also, once an approach is implemented and specified for the browser, it becomes very difficult to innovate on it.
Instead, the easiest way to solve it right now and learn about what would be necessary to implement into the browser would be to actually allow Web developers to queue up a chunk of encoded video into a video element for decoding and display. Thus, the webkitSourceAppend() function was born (specification).
The proposed extension to the HTMLMediaElement is as follows :
partial interface HTMLMediaElement // URL passed to src attribute to enable the media source logic. readonly attribute [URL] DOMString webkitMediaSourceURL ;
bool webkitSourceAppend(in Uint8Array data) ;
// end of stream status codes.
const unsigned short EOS_NO_ERROR = 0 ;
const unsigned short EOS_NETWORK_ERR = 1 ;
const unsigned short EOS_DECODE_ERR = 2 ;void webkitSourceEndOfStream(in unsigned short status) ;
// states
const unsigned short SOURCE_CLOSED = 0 ;
const unsigned short SOURCE_OPEN = 1 ;
const unsigned short SOURCE_ENDED = 2 ;readonly attribute unsigned short webkitSourceState ;
;The code is already checked into WebKit, but commented out behind a command-line compiler flag.
Frank then stepped forward to show how webkitSourceAppend() can be used to implement HTTP adaptive streaming. His example uses WebM – there are no examples with MPEG or Ogg yet.
The chunks that Frank’s demo used were 150 video frames long (6.25s) and 5s long audio. Stream switching only switched video, since audio data is much lower bandwidth and more important to retain at high quality. Switching was done on multiplexed files.
Every chunk requires an XHR range request – this could be optimised if the connections were kept open per adaptation. Seeking works, too, but since decoding requires download of a whole chunk, seeking latency is determined by the time it takes to download and decode that chunk.
Similar to DASH, when using this approach for live streaming, the server has to produce one file per chunk, since byte range requests are not possible on a continuously growing file.
Frank did not use DASH as the manifest format for his HTTP adaptive streaming demo, but instead used a hacked-up custom XML format. It would be possible to use JSON or any other format, too.
After this session, I was actually completely blown away by the possibilities that such a simple API extension allows. If I wasn’t sold on the idea of a appendBytes() function in the earlier session, this one completely changed my mind. While I still believe we need to standardise a HTTP adaptive streaming file format that all browsers will support for all codecs, and I still believe that a native implementation for support of such a file format is necessary, I also believe that this approach of webkitSourceAppend() is what HTML needs – and maybe it needs it faster than native HTTP adaptive streaming support.
Standards for Browser Video Playback Metrics
This session was moderated by Zachary Ozer and Pablo Schklowsky (JWPlayer). Their motivation for the topic was, in fact, also HTTP adaptive streaming. Once you leave the decisions about when to do stream switching to JavaScript (through a function such a wekitSourceAppend()), you have to expose stream metrics to the JS developer so they can make informed decisions. The other use cases is, of course, monitoring of the quality of video delivery for reporting to the provider, who may then decide to change their delivery environment.
The discussion found that we really care about metrics on three different levels :
- measuring the network performance (bandwidth)
- measuring the decoding pipeline performance
- measuring the display quality
In the end, it seemed that work previously done by Steve Lacey on a proposal for video metrics was generally acceptable, except for the playbackJitter metric, which may be too aggregate to mean much.
Device Inputs / A/V in the Browser
I didn’t actually attend this session held by Anant Narayanan (Mozilla), but from what I heard, the discussion focused on how to manage permission of access to video camera, microphone and screen, e.g. when multiple applications (tabs) want access or when the same site wants access in a different session. This may apply to real-time communication with screen sharing, but also to photo sharing, video upload, or canvas access to devices e.g. for time lapse photography.
Open Video Editors
This was another session that I wasn’t able to attend, but I believe the creation of good open source video editing software and similar video creation software is really crucial to giving video a broader user appeal.
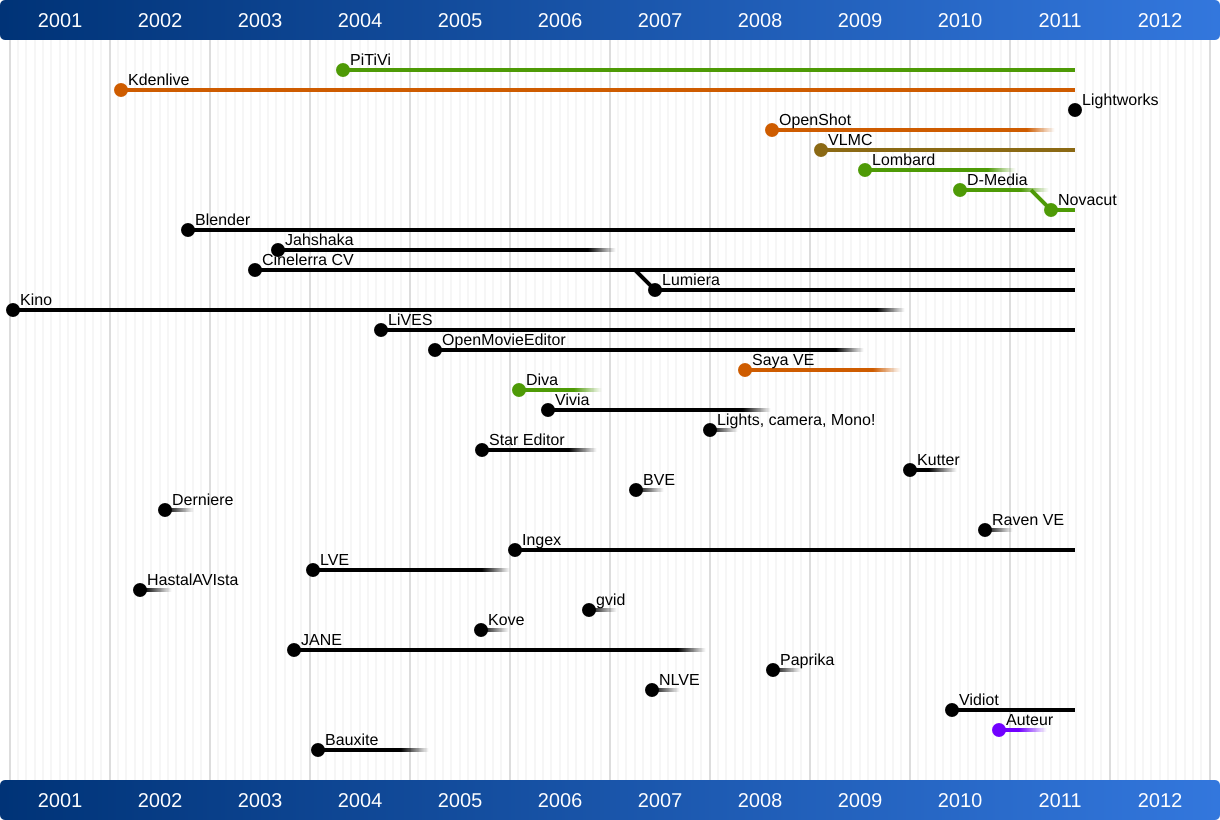
Jeff Fortin (PiTiVi) moderated this session and I was fascinated to later see his analysis of the lifecycle of open source video editors. It is shocking to see how many people/projects have tried to create an open source video editor and how many have stopped their project. It is likely that the creation of a video editor is such a complex challenge that it requires a larger and more committed open source project – single people will just run out of steam too quickly. This may be comparable to the creation of a Web browser (see the size of the Mozilla project) or a text processing system (see the size of the OpenOffice project).
Jeff also mentioned the need to create open video editor standards around playlist file formats etc. Possibly the Open Video Alliance could help. In any case, something has to be done in this space – maybe this would be a good topic to focus next year’s OVC on ?
Monday’s Breakout Groups
The conference ended officially on Sunday night, but we had a third day of discussions / hackday at the wonderful New York Lawschool venue. We had collected issues of interest during the two previous days and organised the breakout groups on the morning (Schedule).
In the Content Protection/DRM session, Mark Watson from Netflix explained how their API works and that they believe that all we need in browsers is a secure way to exchange keys and an indicator of protection scheme is used – the actual protection scheme would not be implemented by the browser, but be provided by the underlying system (media framework/operating system). I think that until somebody actually implements something in a browser fork and shows how this can be done, we won’t have much progress. In my understanding, we may also need to disable part of the video API for encrypted content, because otherwise you can always e.g. grab frames from the video element into canvas and save them from there.
In the Playlists and Gapless Playback session, there was massive brainstorming about what new cool things can be done with the video element in browsers if playback between snippets can be made seamless. Further discussions were about a standard playlist file formats (such as XSPF, MRSS or M3U), media fragment URIs in playlists for mashups, and the need to expose track metadata for HTML5 media elements.
What more can I say ? It was an amazing three days and the complexity of problems that we’re dealing with is a tribute to how far HTML5 and open video has already come and exciting news for the kind of applications that will be possible (both professional and community) once we’ve solved the problems of today. It will be exciting to see what progress we will have made by next year’s conference.
Thanks go to Google for sponsoring my trip to OVC.
UPDATE : We actually have a mailing list for open media developers who are interested in these and similar topics – do join at http://lists.annodex.net/cgi-bin/mailman/listinfo/foms.


