Recherche avancée
Autres articles (99)
-
Amélioration de la version de base
13 septembre 2013Jolie sélection multiple
Le plugin Chosen permet d’améliorer l’ergonomie des champs de sélection multiple. Voir les deux images suivantes pour comparer.
Il suffit pour cela d’activer le plugin Chosen (Configuration générale du site > Gestion des plugins), puis de configurer le plugin (Les squelettes > Chosen) en activant l’utilisation de Chosen dans le site public et en spécifiant les éléments de formulaires à améliorer, par exemple select[multiple] pour les listes à sélection multiple (...) -
Publier sur MédiaSpip
13 juin 2013Puis-je poster des contenus à partir d’une tablette Ipad ?
Oui, si votre Médiaspip installé est à la version 0.2 ou supérieure. Contacter au besoin l’administrateur de votre MédiaSpip pour le savoir -
Contribute to a better visual interface
13 avril 2011MediaSPIP is based on a system of themes and templates. Templates define the placement of information on the page, and can be adapted to a wide range of uses. Themes define the overall graphic appearance of the site.
Anyone can submit a new graphic theme or template and make it available to the MediaSPIP community.
Sur d’autres sites (8239)
-
10 Key Google Analytics Limitations You Should Be Aware Of
9 mai 2022, par ErinGoogle Analytics (GA) is the biggest player in the web analytics space. But is it as “universal” as its brand name suggests ?
Over the years users have pointed out a number of major Google Analytics limitations. Many of these are even more visible in Google Analytics 4.
Introduced in 2020, Google Analytics 4 (GA4) has been sceptically received. As the sunset date of 1st, July 2023 for the current version, Google Universal Analytics (UA), approaches, the dismay grows stronger.
To the point where people are pleading with others to intervene :

Source : Chris Tweten via Twitter Main limitations of Google Analytics
Google Analytics 4 is advertised as a more privacy-centred, comprehensive and “intelligent” web analytics platform.
According to Google, the newest version touts :
- Machine learning at its core provides better segmentation and fast-track access to granular insights
- Privacy-by-design controls, addressing restrictions on cookies and new regulatory demands
- More complete understanding of customer journeys across channels and devices
Some of these claims hold true. Others crumble upon a deeper investigation. Newly advertised Google Analytics capabilities such as ‘custom events’, ‘predictive insights’ and ‘privacy consent mode’ only have marginal improvements.
Complex setup, poor UI and lack of support with migration also leave many other users frustrated with GA4.

Source : Alexander Stoffel via Twitter Let’s unpack all the current (and legacy) limitations of Google Analytics you should account for.
1. No Historical Data Imports
Google rushed users to migrate from Universal Analytics to Google Analytics 4. But they overlooked one important precondition — backwards compatibility.
You have no way to import data from Google Universal Analytics to Google Analytics 4.
Historical records are essential for analysing growth trends and creating benchmarks for new marketing campaigns. Effectively, you are cut short from past insights — and forced to start strategising from scratch.
At present, Google offers two feeble solutions :
- Run data collection in parallel and have separate reporting for GA4 and UA until the latter is shut down. Then your UA records are gone.
- For Ecommerce data, manually duplicate events from UA at a new GA4 property while trying to figure out the new event names and parameters.
Google’s new data collection model is the reason for migration difficulties.
In Google Analytics 4, all analytics hits types — page hits, social hits, app/screen view, etc. — are recorded as events. Respectively, the “‘event’ parameter in GA4 is different from one in Google Universal Analytics as the company explains :

Source : Google This change makes migration tedious — and Google offers little assistance with proper events and custom dimensions set up.
2. Data Collection Limits
If you’ve wrapped your head around new GA4 events, congrats ! You did a great job, but the hassle isn’t over.
You still need to pay attention to new Google Analytics limits on data collection for event parameters and user properties.

Source : Google These apply to :
- Automatically collected events
- Enhanced measurement events
- Recommended events
- Custom events
When it comes to custom events, GA4 also has a limit of 25 custom parameters per event. Even though it seems a lot, it may not be enough for bigger websites.
You can get higher limits by upgrading to Google Analytics 360, but the costs are steep.
3. Limited GDPR Compliance
Google Analytics has a complex history with European GDPR compliance.
A 2020 ruling by the Court of Justice of the European Union (CJEU) invalidated the Privacy Shield framework Google leaned upon. This framework allowed the company to regulate EU-US data transfers of sensitive user data.
But after this loophole was closed, Google faced a heavy series of privacy-related fines :
- French data protection authority, CNIL, ruled that “the transfers to the US of personal data collected through Google Analytics are illegal” — and proceeded to fine Google for a record-setting €150 million at the beginning of 2022.
- Austrian regulators also deemed Google in breach of GDPR requirements and also branded the analytics as illegal.
Other EU-member states might soon proceed with similar rulings. These, in turn, can directly affect Google Analytics users, whose businesses could face brand damage and regulatory fines for non-compliance. In fact, companies cannot select where the collected analytics data will be stored — on European servers or abroad — nor can they obtain this information from Google.
Getting a web analytics platform that allows you to keep data on your own servers or select specific Cloud locations is a great alternative.
Google also has been lax with its cookie consent policy and doesn’t properly inform consumers about data collection, storage or subsequent usage. Google Analytics 4 addresses this issue to an extent.
By default, GA4 relies on first-party cookies, instead of third-party ones — which is a step forward. But the user privacy controls are hard to configure without losing most of the GA4 functionality. Implementing user consent mode to different types of data collection also requires a heavy setup.
4. Strong Reliance on Sampled Data
To compensate for ditching third-party cookies, GA4 more heavily leans on sampled data and machine learning to fill the gaps in reporting.
In GA4 sampling automatically applies when you :
- Perform advanced analysis such as cohort analysis, exploration, segment overlap or funnel analysis with not enough data
- Have over 10,000,000 data rows and generate any type of non-default report
Google also notes that data sampling can occur at lower thresholds when you are trying to get granular insights. If there’s not enough data or because Google thinks it’s too complex to retrieve.
In their words :

Source : Google Data sampling adds “guesswork” to your reports, meaning you can’t be 100% sure of data accuracy. The divergence from actual data depends on the size and quality of sampled data. Again, this isn’t something you can control.
Unlike Google Analytics 4, Matomo applies no data sampling. Your reports are always accurate and fully representative of actual user behaviours.
5. No Proper Data Anonymization
Data anonymization allows you to collect basic analytics about users — visits, clicks, page views — but without personally identifiable information (or PII) such as geo-location, assigns tracking ID or other cookie-based data.
This reduced your ability to :
- Remarket
- Identify repeating visitors
- Do advanced conversion attribution
But you still get basic data from users who ignored or declined consent to data collection.
By default, Google Analytics 4 anonymizes all user IP addresses — an upgrade from UA. However, it still assigned a unique user ID to each user. These count as personal data under GDPR.
For comparison, Matomo provides more advanced privacy controls. You can anonymize :
- Previously tracked raw data
- Visitor IP addresses
- Geo-location information
- User IDs
This can ensure compliance, especially if you operate in a sensitive industry — and delight privacy-mindful users !
6. No Roll-Up Reporting
Getting a bird’s-eye view of all your data is helpful when you need hotkey access to main sites — global traffic volume, user count or percentage of returning visitors.
With Roll-Up Reporting, you can see global-performance metrics for multiple localised properties (.co.nz, .co.uk, .com, etc,) in one screen. Then zoom in on specific localised sites when you need to.

7. Report Processing Latency
The average data processing latency is 24-48 hours with Google Analytics.
Accounts with over 200,000 daily sessions get data refreshes only once a day. So you won’t be seeing the latest data on core metrics. This can be a bummer during one-day promo events like Black Friday or Cyber Monday when real-time information can prove to be game-changing !
Matomo processes data with lower latency even for high-traffic websites. Currently, we have 6-24 hour latency for cloud deployments. On-premises web analytics can be refreshed even faster — within an hour or instantly, depending on the traffic volumes.
8. No Native Conversion Optimisation Features
Google Analytics users have to use third-party tools to get deeper insights like how people are interacting with your webpage or call-to-action.
You can use the free Google Optimize tool, but it comes with limits :
- No segmentation is available
- Only 10 simultaneous running experiments allowed
There isn’t a native integration between Google Optimize and Google Analytics 4. Instead, you have to manually link an Optimize Container to an analytics account. Also, you can’t select experiment dimensions in Google Analytics reports.
What’s more, Google Optimize is a basic CRO tool, best suited for split testing (A/B testing) of copy, visuals, URLs and page layouts. If you want to get more advanced data, you need to pay for extra tools.
Matomo comes with a native set of built-in conversion optimization features :
- Heatmaps
- User session recording
- Sales funnel analysis
- A/B testing
- Form submission analytics

A/B test hypothesis testing on Matomo 9. Deprecated Annotations
Annotations come in handy when you need to provide extra context to other team members. For example, point out unusual traffic spikes or highlight a leak in the sales funnel.
This feature was available in Universal Analytics but is now gone in Google Analytics 4. But you can still quickly capture, comment and share knowledge with your team in Matomo.
You can add annotations to any graph that shows statistics over time including visitor reports, funnel analysis charts or running A/B tests.
10. No White Label Option
This might be a minor limitation of Google Analytics, but a tangible one for agency owners.
Offering an on-brand, embedded web analytics platform can elevate your customer experience. But white label analytics were never a thing with Google Analytics, unlike Matomo.
Wrap Up
Google set a high bar for web analytics. But Google Analytics inherent limitations around privacy, reporting and deployment options prompt more users to consider Google Analytics alternatives, like Matomo.
With Matomo, you can easily migrate your historical data records and store customer data locally or in a designated cloud location. We operate by a 100% unsampled data principle and provide an array of privacy controls for advanced compliance.
Start your 21-day free trial (no credit card required) to see how Matomo compares to Google Analytics !
21 day free trial. No credit card required.

-
Lean Analytics in a Privacy-First Environment – Bootcamp with Timo Dechau
29 novembre 2024, par Daniel Crough — Banking and Financial Services, GDPR, Marketing, Privacy, Videos, Featured Banking ContentIn a recent bootcamp, Timo Dechau walked attendees through his approach to data and measurement in privacy-focused analytics environments. He demonstrates how to shift from a chaotic, ‘track-it-all’ mentality to a focused method that prioritizes quality over quantity. This post will summarize some of his key privacy-first analytics ideas, but be sure to check out the on-demand video for more detail.
Watch the bootcamp on demand
<script type="text/javascript">var gform;gform||(document.addEventListener("gform_main_scripts_loaded",function(){gform.scriptsLoaded=!0}),window.addEventListener("DOMContentLoaded",function(){gform.domLoaded=!0}),gform={domLoaded:!1,scriptsLoaded:!1,initializeOnLoaded:function(o){gform.domLoaded&&gform.scriptsLoaded?o():!gform.domLoaded&&gform.scriptsLoaded?window.addEventListener("DOMContentLoaded",o):document.addEventListener("gform_main_scripts_loaded",o)},hooks:{action:{},filter:{}},addAction:function(o,n,r,t){gform.addHook("action",o,n,r,t)},addFilter:function(o,n,r,t){gform.addHook("filter",o,n,r,t)},doAction:function(o){gform.doHook("action",o,arguments)},applyFilters:function(o){return gform.doHook("filter",o,arguments)},removeAction:function(o,n){gform.removeHook("action",o,n)},removeFilter:function(o,n,r){gform.removeHook("filter",o,n,r)},addHook:function(o,n,r,t,i){null==gform.hooks[o][n]&&(gform.hooks[o][n]=[]);var e=gform.hooks[o][n];null==i&&(i=n+"_"+e.length),gform.hooks[o][n].push({tag:i,callable:r,priority:t=null==t?10:t})},doHook:function(n,o,r){var t;if(r=Array.prototype.slice.call(r,1),null!=gform.hooks[n][o]&&((o=gform.hooks[n][o]).sort(function(o,n){return o.priority-n.priority}),o.forEach(function(o){"function"!=typeof(t=o.callable)&&(t=window[t]),"action"==n?t.apply(null,r):r[0]=t.apply(null,r)})),"filter"==n)return r[0]},removeHook:function(o,n,t,i){var r;null!=gform.hooks[o][n]&&(r=(r=gform.hooks[o][n]).filter(function(o,n,r){return!!(null!=i&&i!=o.tag||null!=t&&t!=o.priority)}),gform.hooks[o][n]=r)}});</script><script><br />
gform.initializeOnLoaded( function() {gformInitSpinner( 72, 'https://matomo.org/wp-content/plugins/gravityforms/images/spinner.svg', true );jQuery('#gform_ajax_frame_72').on('load',function(){var contents = jQuery(this).contents().find('*').html();var is_postback = contents.indexOf('GF_AJAX_POSTBACK') >= 0;if(!is_postback){return;}var form_content = jQuery(this).contents().find('#gform_wrapper_72');var is_confirmation = jQuery(this).contents().find('#gform_confirmation_wrapper_72').length > 0;var is_redirect = contents.indexOf('gformRedirect(){') >= 0;var is_form = form_content.length > 0 && ! is_redirect && ! is_confirmation;var mt = parseInt(jQuery('html').css('margin-top'), 10) + parseInt(jQuery('body').css('margin-top'), 10) + 100;if(is_form){jQuery('#gform_wrapper_72').html(form_content.html());if(form_content.hasClass('gform_validation_error')){jQuery('#gform_wrapper_72').addClass('gform_validation_error');} else {jQuery('#gform_wrapper_72').removeClass('gform_validation_error');}setTimeout( function() { /* delay the scroll by 50 milliseconds to fix a bug in chrome */ }, 50 );if(window['gformInitDatepicker']) {gformInitDatepicker();}if(window['gformInitPriceFields']) {gformInitPriceFields();}var current_page = jQuery('#gform_source_page_number_72').val();gformInitSpinner( 72, 'https://matomo.org/wp-content/plugins/gravityforms/images/spinner.svg', true );jQuery(document).trigger('gform_page_loaded', [72, current_page]);window['gf_submitting_72'] = false;}else if(!is_redirect){var confirmation_content = jQuery(this).contents().find('.GF_AJAX_POSTBACK').html();if(!confirmation_content){confirmation_content = contents;}setTimeout(function(){jQuery('#gform_wrapper_72').replaceWith(confirmation_content);jQuery(document).trigger('gform_confirmation_loaded', [72]);window['gf_submitting_72'] = false;wp.a11y.speak(jQuery('#gform_confirmation_message_72').text());}, 50);}else{jQuery('#gform_72').append(contents);if(window['gformRedirect']) {gformRedirect();}}jQuery(document).trigger("gform_pre_post_render", [{ formId: "72", currentPage: "current_page", abort: function() { this.preventDefault(); } }]); if (event.defaultPrevented) { return; } const gformWrapperDiv = document.getElementById( "gform_wrapper_72" ); if ( gformWrapperDiv ) { const visibilitySpan = document.createElement( "span" ); visibilitySpan.id = "gform_visibility_test_72"; gformWrapperDiv.insertAdjacentElement( "afterend", visibilitySpan ); } const visibilityTestDiv = document.getElementById( "gform_visibility_test_72" ); let postRenderFired = false; function triggerPostRender() { if ( postRenderFired ) { return; } postRenderFired = true; jQuery( document ).trigger( 'gform_post_render', [72, current_page] ); gform.utils.trigger( { event: 'gform/postRender', native: false, data: { formId: 72, currentPage: current_page } } ); if ( visibilityTestDiv ) { visibilityTestDiv.parentNode.removeChild( visibilityTestDiv ); } } function debounce( func, wait, immediate ) { var timeout; return function() { var context = this, args = arguments; var later = function() { timeout = null; if ( !immediate ) func.apply( context, args ); }; var callNow = immediate && !timeout; clearTimeout( timeout ); timeout = setTimeout( later, wait ); if ( callNow ) func.apply( context, args ); }; } const debouncedTriggerPostRender = debounce( function() { triggerPostRender(); }, 200 ); if ( visibilityTestDiv && visibilityTestDiv.offsetParent === null ) { const observer = new MutationObserver( ( mutations ) => { mutations.forEach( ( mutation ) => { if ( mutation.type === 'attributes' && visibilityTestDiv.offsetParent !== null ) { debouncedTriggerPostRender(); observer.disconnect(); } }); }); observer.observe( document.body, { attributes: true, childList: false, subtree: true, attributeFilter: [ 'style', 'class' ], }); } else { triggerPostRender(); } } );} );<br />
</script>
Unrestrained data collection leads to data bloat
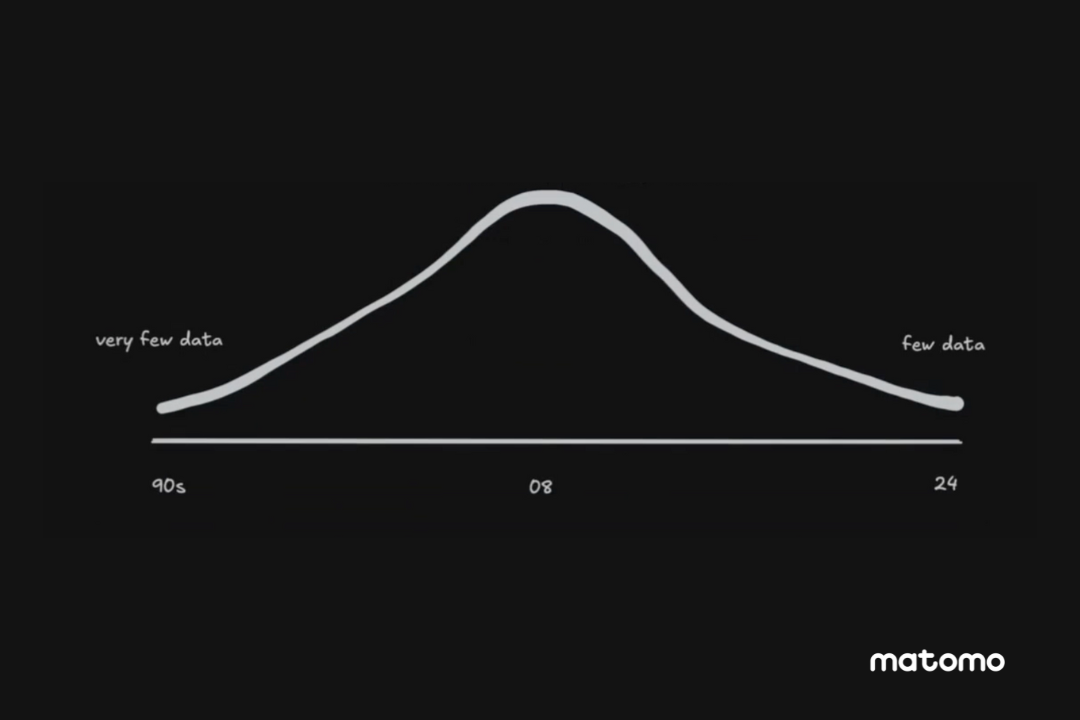
Marketing and the business world are experiencing a data problem. Analysts and business intelligence teams grapple with large amounts of data that aren’t always useful and are often incomplete. The idea that “more data is better” became a guiding principle in the early 2000s, encouraging companies to gather everything possible using all available data collection methods. This unrestrained pursuit often led to an unexpected problem : data bloat. Too much data, too little clarity. Digital marketers, analysts, and business leaders now try to navigate vast amounts of information that create more confusion than insight, especially when the data is incomplete due to privacy regulations.

Cutting through the noise, focusing on what matters
The “more data is better” mindset emerged when digital marketers were beginning to understand data’s potential. It seemed logical : more data should mean more opportunities to optimise, personalise, and drive results. But in practice, gathering every possible piece of data often leads to a cluttered, confusing pile of metrics that can mislead more than guide.
This approach carries hidden costs. Excessive data collection burns resources, increases privacy concerns, and leaves teams unfocused. It’s easy to get lost trying to make sense of endless dashboards, metrics, and reports. More data doesn’t necessarily lead to better decisions ; it often just leads to more noise, hindering effective data management.
Rethinking data management : From data overload to data mindfulness
Data management has often prioritised comprehensive data gathering without considering the specific value of each data point. This approach has created more information, but not necessarily better insights.
Data mindfulness is about taking a deliberate, focused approach to data collection and analysis. Instead of trying to collect everything, it emphasises gathering only what truly adds value. It’s about ensuring the data you collect serves a purpose and directly contributes to better insights and data-driven decision-making.
Think of it like applying a “lean” methodology to data—trimming away the unnecessary and keeping only what is essential. Or consider embracing data minimalism to declutter your data warehouse, keeping only what truly sparks insight.

Mindful data is ethical data
Adopting a mindful approach to data can pay off in several ways :
-
Reduces overwhelm : When you reduce the clutter, you’re left with fewer, clearer metrics that lead to stronger decisions and actionable data insights.
-
Mitigates compliance risks : By collecting less, companies align better with privacy regulations and build trust with their customers. Privacy-first analytics and privacy-compliant analytics practices mean there’s no need for invasive tracking if it doesn’t add value—and customers will appreciate that.
-
Enhances data ethics : Focusing on the quality rather than the quantity of data collected ensures ethical data collection and management. Companies use data responsibly, respect user privacy, and minimise unnecessary data handling, strengthening customer relationships and brand integrity.
-
Improves data efficiency : Focused analytics means better use of resources. You’re spending less time managing meaningless metrics and more time working on meaningful insights. Many companies have found success by switching to a leaner, quality-first data approach, reporting sharper, more impactful results.
Shifting towards simplicity and lean analytics
If data mindfulness sounds appealing, here’s how you can get started :
-
Ask the right questions. Before collecting any data, ask yourself : Why are we collecting this ? How will it drive value ? If you can’t answer these questions clearly, that data probably isn’t worth collecting. This is a key step in smart data management.
-
Simplify metrics. Focus on the KPIs that truly matter for your business. Choose a handful of key metrics that reflect your goals rather than a sprawling list of nice-to-haves. Embracing data simplicity helps in targeting data collection effectively.
-
Audit your current data. Review your existing data collection processes. Which metrics are you actively using to make decisions ? Eliminate any redundant or low-value metrics that create noise. Use ethical data management practices to ensure data efficiency and compliance. Understanding what is data management in this context is crucial.
-
Implement lean analytics practices. Shift towards lean analytics by cutting down on unnecessary tracking. This can involve reducing reliance on multiple tracking scripts, simplifying your reporting, and setting up a streamlined dashboard focused on key outcomes. Embrace data reduction strategies to eliminate waste and boost effectiveness.
Who should watch this bootcamp
This bootcamp is perfect for data analysts, product managers, digital marketers and business leaders who are seeking a more streamlined approach to data measurement. If you’re interested in moving away from a chaotic “track-it-all” mentality and towards a focused, lean, and privacy-first analytics strategy, this workshop is for you.
What you’ll discover
-
Practical steps : Learn actionable strategies to reduce data bloat and implement lean, privacy-first analytics in your organisation.
-
Real-life examples : Explore case studies of companies that have successfully adopted focused and privacy-first analytics.
-
Deep insights : Gain a deeper understanding of how to prioritise quality over quantity without sacrificing valuable insights.
Watch the bootcamp on-demand
For a comprehensive dive into these topics, watch the full workshop video or download the detailed transcript. Equip yourself with the knowledge and tools to transform your data management approach today.
<script><br />
gform.initializeOnLoaded( function() {gformInitSpinner( 72, 'https://matomo.org/wp-content/plugins/gravityforms/images/spinner.svg', true );jQuery('#gform_ajax_frame_72').on('load',function(){var contents = jQuery(this).contents().find('*').html();var is_postback = contents.indexOf('GF_AJAX_POSTBACK') >= 0;if(!is_postback){return;}var form_content = jQuery(this).contents().find('#gform_wrapper_72');var is_confirmation = jQuery(this).contents().find('#gform_confirmation_wrapper_72').length > 0;var is_redirect = contents.indexOf('gformRedirect(){') >= 0;var is_form = form_content.length > 0 && ! is_redirect && ! is_confirmation;var mt = parseInt(jQuery('html').css('margin-top'), 10) + parseInt(jQuery('body').css('margin-top'), 10) + 100;if(is_form){jQuery('#gform_wrapper_72').html(form_content.html());if(form_content.hasClass('gform_validation_error')){jQuery('#gform_wrapper_72').addClass('gform_validation_error');} else {jQuery('#gform_wrapper_72').removeClass('gform_validation_error');}setTimeout( function() { /* delay the scroll by 50 milliseconds to fix a bug in chrome */ }, 50 );if(window['gformInitDatepicker']) {gformInitDatepicker();}if(window['gformInitPriceFields']) {gformInitPriceFields();}var current_page = jQuery('#gform_source_page_number_72').val();gformInitSpinner( 72, 'https://matomo.org/wp-content/plugins/gravityforms/images/spinner.svg', true );jQuery(document).trigger('gform_page_loaded', [72, current_page]);window['gf_submitting_72'] = false;}else if(!is_redirect){var confirmation_content = jQuery(this).contents().find('.GF_AJAX_POSTBACK').html();if(!confirmation_content){confirmation_content = contents;}setTimeout(function(){jQuery('#gform_wrapper_72').replaceWith(confirmation_content);jQuery(document).trigger('gform_confirmation_loaded', [72]);window['gf_submitting_72'] = false;wp.a11y.speak(jQuery('#gform_confirmation_message_72').text());}, 50);}else{jQuery('#gform_72').append(contents);if(window['gformRedirect']) {gformRedirect();}}jQuery(document).trigger("gform_pre_post_render", [{ formId: "72", currentPage: "current_page", abort: function() { this.preventDefault(); } }]); if (event.defaultPrevented) { return; } const gformWrapperDiv = document.getElementById( "gform_wrapper_72" ); if ( gformWrapperDiv ) { const visibilitySpan = document.createElement( "span" ); visibilitySpan.id = "gform_visibility_test_72"; gformWrapperDiv.insertAdjacentElement( "afterend", visibilitySpan ); } const visibilityTestDiv = document.getElementById( "gform_visibility_test_72" ); let postRenderFired = false; function triggerPostRender() { if ( postRenderFired ) { return; } postRenderFired = true; jQuery( document ).trigger( 'gform_post_render', [72, current_page] ); gform.utils.trigger( { event: 'gform/postRender', native: false, data: { formId: 72, currentPage: current_page } } ); if ( visibilityTestDiv ) { visibilityTestDiv.parentNode.removeChild( visibilityTestDiv ); } } function debounce( func, wait, immediate ) { var timeout; return function() { var context = this, args = arguments; var later = function() { timeout = null; if ( !immediate ) func.apply( context, args ); }; var callNow = immediate && !timeout; clearTimeout( timeout ); timeout = setTimeout( later, wait ); if ( callNow ) func.apply( context, args ); }; } const debouncedTriggerPostRender = debounce( function() { triggerPostRender(); }, 200 ); if ( visibilityTestDiv && visibilityTestDiv.offsetParent === null ) { const observer = new MutationObserver( ( mutations ) => { mutations.forEach( ( mutation ) => { if ( mutation.type === 'attributes' && visibilityTestDiv.offsetParent !== null ) { debouncedTriggerPostRender(); observer.disconnect(); } }); }); observer.observe( document.body, { attributes: true, childList: false, subtree: true, attributeFilter: [ 'style', 'class' ], }); } else { triggerPostRender(); } } );} );<br />
</script> -
-
How to Track Website Visitors : Benefits, Tools and FAQs
31 août 2023, par Erin — Analytics Tips, MarketingBusinesses spend a ton of time, money and effort into creating websites that are not only helpful and captivating, but also highly effective at converting visitors. They’ll create content, revise designs, add new pages and change forms, all in the hope of getting visitors to stay on the site and convert into leads or customers.
When you track website visitors, you can see which of your efforts are moving the needle. While many people are familiar with pageviews as a metric, website visitor tracking can be much more in-depth and insightful.
In this article, we’ll cover how website visitor tracking works, what you can track, and how this information can improve sales and marketing results. We’ll also explain global privacy concerns and how businesses can choose the right tracking software.
What is website visitor tracking ?
Website visitor tracking uses software and applications to track and analyse how visitors interact with your website. It’s a vital tool to help businesses understand whether their website design and content are having the desired effect.

Website visitor tracking includes very broad, non-specific data, like how many times visitors have come to your site. But it can also get very specific, with personal information about the user and even recordings of their visit to your site. Site visits, which may include visiting several different pages of the same site, are often referred to as “sessions.”
Although Google Analytics is the most widely used website visitor tracking software, it isn’t the most comprehensive or powerful. Companies that want a more in-depth understanding of their website may need to consider running a more precise tool alongside Google Analytics, like Matomo.
As we’ll cover later, website tracking has many important business applications, but it also poses privacy and security concerns, causing some states and countries to impose strict regulations. Privacy laws and your company’s values should also impact what web analytics tool you choose.
How website tracking works
Website tracking starts with the collection of data as users interact with the website. Tracking technologies like cookies, JavaScript and pixels are embedded into web pages. These technologies then gather data about user behaviour, session details and user actions, such as pageviews, clicks, form submissions and more.
More advanced tracking systems assign unique identifiers (such as cookies or visitor IDs) to individual users. This enables tracking of user journeys across multiple sessions and pages. These detailed journeys can often tell a different story and provide different insights than aggregated numbers do.
All this collected data is transmitted from the user’s browser to a centralised tracking system, which can be a third-party web analytics tool or a self-hosted solution. The collected data is stored in databases and processed to generate meaningful insights. This process involves organising the data, aggregating metrics, and creating reports.
Analytics tools process the collected data to generate reports and visualisations that provide insights into user behaviour. Metrics such as pageviews, bounce rates, conversion rates and user paths are analysed. Good web analytics tools are able to present these insights in a user-friendly way. Analysts and marketing professionals then use this knowledge to make informed decisions to improve the user experience (UX).
Advanced tracking systems allow data segmentation and filtering based on various criteria, such as user demographics, traffic sources, devices and more. This enables deeper analysis of specific user groups. For example, you might find that your conversion rate is much lower when your website is viewed on a mobile device. You can then dig deeper into that segment of data to find out why and experiment with changes that might increase mobile conversions.
3 types of website tracking and their benefits
There are three main categories of website tracking, and they each provide different information that can be used by sales, marketing, engineering and others. Here, we cover those three types and how businesses use them to understand customers and create better experiences.
Website analytics
Website analytics is all about understanding the traffic your website receives. This type of tracking allows you to learn how the website performs based on pageviews, real-time traffic, bounce rate and conversions.
For example, you would use website analytics to determine how effectively your homepage drives people toward a product or pricing page. You can use pageviews and previous page statistics to learn how many people who land on your homepage read your blog posts. From there, you could use web analytics to determine the conversion rate of the call to action at the end of each article.

User behaviour
While website analytics focuses on the website’s performance, user behaviour tracking is about monitoring and quantifying user behaviour. One of the most obvious aspects of user behaviour is what they click on, but there are many other actions you can track.
The time a user spends on a page can help you determine whether the content on the page is engaging. Some tracking tools can also measure how far down the page a user scrolls, which reveals whether some content is even being seen.
Session recordings are another popular tool for analysing user behaviour. They not only show concrete actions, like clicks, but can also show how the user moves throughout the page. Where do they stop ? What do they scroll right past ? This is one example of how user behaviour data can be quantitative or qualitative.
Visitor information
Tracking can also include gathering or uncovering information about visitors to your site. This might include demographic information, such as language and location, or details like what device a website visitor is using and on which browser they view your website.
This type of data helps your web and marketing teams make better decisions about how to design and format the site. If you know, for example, that the website for your business-to-business (B2B) software is overwhelmingly viewed on desktop computers, that will affect how you structure your pages and choose images.
Similarly, if visitor information tells you that you have a significant audience in France, your marketing team might develop new content to appeal to those potential customers.
Use website visitor tracking to improve marketing, sales and UX
Website visitor tracking has various applications for different parts of your business, from marketing to sales and much more. When you understand the impact tracking has on different teams, you can better evaluate your company’s needs and build buy-in among stakeholders.
Marketing
At many companies, the marketing team owns and determines what kind of content is on your website. From landing pages to blog posts to the navigation bar, you want to create an experience that drives people toward making a purchase. When marketers can track website visitors, they can get a real look at how visitors respond to and engage with their marketing efforts. Pageviews, conversion rates and time spent on pages help them better understand what your customers care about and what messaging resonates.
But web analytics can even help marketing teams better understand how their external marketing campaigns are performing. Tracking tools like Matomo reveal your most important traffic sources. The term “traffic source” refers to the content or web property from which someone arrives at your site.
For instance, you might notice that an older page got a big boost in traffic this month. You can then check the traffic sources, where you find that an influential LinkedIn user posted a link to the page. This presents an opportunity to adjust the influencer or social media aspects of your marketing strategy.
Beyond traffic sources, Matomo can provide a visual user journey (also known as User Flow), showing which pages visitors tend to view in a session and even in what order they progress. This gives you a bird’s-eye view of the customer journey.
Sales
Just like your marketing team, your sales team can benefit from tracking and analysing website visitor information. Data about user behaviour and visitor demographics helps sales representatives better understand the people they’re talking to. Segmented visitor tracking data can even provide clues as to how to appeal to different buyer personas.
Sales leadership can use web analytics to gauge interest over time, tie visitors to revenue and develop more accurate sales forecasts and goals.
And it’s not just aggregated website tracking data that your sales team can use to better serve customers. They can also use insights about an individual visitor to tailor their approach. Matomo’s Visits Log report and Visitor Profiles allow you to see which pages a prospect has viewed. This tells your sales team which products and features the prospect is most interested in, leading to more relevant interactions and more effective sales efforts.
User experience and web development
The way users interact with and experience your website has a big impact on their impression of your brand and, ultimately, whether they become customers. While marketing often controls much of a website’s content, the backend and technical operation of the site usually falls to a web development or engineering team. Website analytics and tracking inform their work, too.
Along with data about website traffic and conversion rates, web development teams often monitor bounce rates (the percentage of people who leave your website entirely after landing on a page) and page load time (the time it takes for an individual web page to load for a user). Besides the fact that slow loading times inconvenience visitors, they can also negatively affect your search engine optimization (SEO).
Along with session recordings, user experience teams and web developers may use heatmaps to find out what parts of a page draw a visitor’s attention and where they are most likely to convert or take some other action. They can then use these insights to make a web page more intuitive and useful.
Visitor tracking and privacy regulations
There are different data privacy standards in other parts of the world, which are designed to ensure that businesses collect and use consumer data ethically. The most-discussed of these privacy standards is the General Data Protection Regulation (GDPR), which was instituted by the European Union (EU) but affects businesses worldwide. However, it’s important to note that individual countries or states can have different privacy laws.
Many privacy laws govern how websites can use cookies to track visitors. With a user’s consent, cookies can help websites identify and remember visitors. However, many web visitors will reject cookie consent banners. When this happens, analysts and marketers can’t collect information from these visitors and have to work with incomplete tracking data. Incomplete data leads to poor decision-making. What’s more, cookie consent banners can create a poor user experience and often annoy web visitors.
With Matomo’s industry-leading measures to protect user privacy, France’s data protection agency (CNIL) has confirmed that Matomo is exempt from tracking consent in France. Matomo users have peace of mind knowing they can uphold the GDPR and collect data without needing to collect and track cookie consent. Only in Germany and the UK are cookie consent banners still required.
Choosing user tracking software
The benefits and value of tracking website visitors are enormous, but not all tracking software is equal. Different tools have different core functionalities. For instance, some focus on user behaviour over traditional web analytics. Others offer detailed website performance data but offer little in the way of visitor information. It’s a good idea to start by identifying your company’s most important tracking goals.
Along with core features, look for useful tools to experiment with and optimise your website with. For example, Matomo enables A/B testing while many other tools do not.
Along with users of your website, you also need to think about the employees who will be using the tracking software. The interface can have a big impact on the value you get from a tool. Matomo’s session recording functionality, for example, not only provides you with video but with a colour-coded timeline identifying important user actions.
Privacy standards and compliance should also be a part of the conversation. Different tools use different tracking methods, impacting accuracy and security and can even cause legal trouble. You should consider which data privacy laws you are subject to, as well as the privacy expectations of your users.

Some industries have especially high data security standards. Government and healthcare organisations, for example, may require visitor tracking software that is hosted on their premises. While there are many purely cloud-based software-as-a-service (SaaS) tracking tools, Matomo is available both On-Premise (also known as self-hosted) and in the Cloud.
Frequently asked questions
Here are answers to some of people’s most common questions about tracking website visitors.
Can you track who visited your website ?
In most cases, tracking your website’s traffic is possible. Still, the extent of the tracking depends on the visitor-tracking technology you use and the privacy settings and precautions the visitor uses. For example, some technologies can pinpoint users by IP address. In other cases, you may only have access to anonymized data.
Is it legal to track someone’s IP address ?
It is legal for websites and businesses to track someone’s IP address in the sense that they can identify that someone from the same IP address is visiting a page repeatedly. Under the General Data Protection Regulation (GDPR), IP addresses are considered personally identifiable information (PII). The GDPR mandates that websites only log and store a user’s IP address with the user’s consent.
How do you find where visitors are clicking the most ?
Heatmap tools are among the most common tools for learning where visitors click the most on your website. Heatmaps use colour-coding to show what parts of a web page users either click on or hover over the most.
Unique tracking URLs are another way to determine what part of your website gets the most clicks. For example, if you have three links on a page that all go to the same destination, you can use tracking links to determine how many clicks each link generates.
Matomo also offers a Tag Manager within the platform that lets you manage and unify all your tracking and marketing tags to find out where visitors are clicking.
What is the best tool for website visitor tracking ?
Like most tools, the best website visitor tracking tool depends on your needs. Each tool offers different functionalities, user interfaces and different levels of accuracy and privacy. Matomo is a good choice for companies that value privacy, compliance and accuracy.
Tracking for powerful insights and better performance
Tracking website visitors is now a well-ingrained part of business operations. From sales reps seeking to understand their leads to marketers honing their ad spend, tracking helps teams do their jobs better.
Take the time to consider what you want to learn from website tracking and let those priorities guide your choice of visitor tracking software. Whatever your industry or needs, user privacy and compliance must be a priority.
Find out how much detail and insight Matomo can give you with our free 21-day trial — no credit card required.