Recherche avancée

Autres articles (40)
-
Publier sur MédiaSpip
13 juin 2013Puis-je poster des contenus à partir d’une tablette Ipad ?
Oui, si votre Médiaspip installé est à la version 0.2 ou supérieure. Contacter au besoin l’administrateur de votre MédiaSpip pour le savoir -
Librairies et logiciels spécifiques aux médias
10 décembre 2010, par kent1Pour un fonctionnement correct et optimal, plusieurs choses sont à prendre en considération.
Il est important, après avoir installé apache2, mysql et php5, d’installer d’autres logiciels nécessaires dont les installations sont décrites dans les liens afférants. Un ensemble de librairies multimedias (x264, libtheora, libvpx) utilisées pour l’encodage et le décodage des vidéos et sons afin de supporter le plus grand nombre de fichiers possibles. Cf. : ce tutoriel ; FFMpeg avec le maximum de décodeurs et (...) -
Les autorisations surchargées par les plugins
27 avril 2010, par kent1Mediaspip core
autoriser_auteur_modifier() afin que les visiteurs soient capables de modifier leurs informations sur la page d’auteurs
Sur d’autres sites (7011)
-
What is Funnel Analysis ? A Complete Guide for Quick Results
25 janvier 2024, par ErinYour funnel is leaking.
You’re losing visitors.
You’re losing conversions and sales.
But you don’t know how it’s happening, where it’s happening, or what to do about it.
The reason ? You aren’t properly analysing your funnels.
If you want to improve conversions and grow your business, you need to understand how to properly assess your sales funnels to set yourself up for success.
In this guide, we’ll show you what funnel analysis is, why it’s important, and what steps you need to take to leverage it to improve conversions.
What is funnel analysis ?
Every business uses sales funnels, whether they know it or not.
But most people aren’t analysing them, costing them conversions.

Funnel analysis is a marketing method to analyse the events leading to specific conversion points.
It aims to look at the entire journey of potential customers from the moment they first touch base with your website or business to the moment they click “buy.”
It’s assessing what your audience is doing at every step of the journey.
By assessing what actions are taking place at scale, you can see where you’re falling short in your sales funnel.
You’ll see :
- Where prospects are falling off.
- Where people are converting well.
By gaining this understanding, you’ll better understand the health of your website’s sales funnels and overall marketing strategy.
With that knowledge, you can optimise your marketing strategy to patch those leaks, improve conversions and grow your business.
Why funnel analysis is important
Funnel analysis is critical because your funnel is your business.
When you analyse your funnel, you’re analysing your business.
You’re looking at what’s working and what’s not so you can grow revenue and profit margins.
Funnel analysis lets you monitor user behaviour to show you the motivation and intention behind their decisions.
Here are five reasons you need to incorporate funnel analysis into your workflow.

1. Gives insights into your funnel problems
The core purpose of funnel analysis is to look at what’s going on on your website.
What are the most effective steps to conversion ?
Where do users drop off in the conversion process ?
And which pages contribute the most to conversion or drop-offs ?
Funnel analysis helps you understand what’s going on with your site visitors. Plus, it helps you see what’s wrong with your funnel.
If you aren’t sure what’s happening with your funnel, you won’t know what to improve to grow your revenue.
2. Improves conversions
When you know what’s going on with your funnel, you’ll know how to improve it.
To improve your conversion funnel, you need to close the leaks. These are areas where website visitors are falling off.
It’s the moment the conversion is lost.
You need to use funnel analysis to give insight into these problem areas. Once you can see where the issue is, you can patch that leak and improve the percentage of visitors who convert.
For example, if your conversion rate on your flagship product page has plateaued and you can’t figure out how to increase conversions, implementing a funnel analysis tactic like heatmaps will show you that visitors are spending time reading your product description. Still, they’re not spending much time near your call to action.

This might tell you that you need to update your description copy or adjust your button (i.e. colour, size, copy). You can increase conversions by making those changes in your funnel analysis insights.
3. Improves the customer experience
Funnel analysis helps you see where visitors spend their time, what elements they interact with and where they fall off.
One of the key benefits of analysing your funnel is you’ll be able to help improve the experience your visitors have on your website.
For example, if you have informational videos on a specific web page to educate your visitors, you might use the Media Analytics feature in your web analytics solution to find out that they’re not spending much time watching them.
This could lead you to believe that the content itself isn’t good or relevant to them.
But, after implementing session recordings within your funnel analysis, you see people clicking a ton near the play button. This might tell you that they’re having trouble clicking the actual button on the video player due to poor UX.
In this scenario, you could update the UX on your web page so the videos are easy to click and watch, no matter what device someone uses.
With more video viewers, you can provide value to your visitors instead of leaving them frustrated trying to watch your videos.
4. Grows revenue
This is what you’re likely after : more revenue.
More often than not, this means you need to focus on improving your conversion rate.
Funnel analysis helps you find those areas where visitors are exiting so you can patch those leaks up and turn more visitors into customers.
Let’s say you have a conversion rate of 1.7%.
You get 50,000 visitors per month.
Your average order is $82.
Even if you increase your conversion rate by 10% (to 1.87%) through funnel analysis, here’s the monthly difference in revenue :
Before : $69,700
After : $76,670In one year, you’ll make nearly $80,000 in additional revenue from funnel analysis alone.
Different types of funnel analysis
There are a few different types of funnel analysis.
How you define success in your funnel all comes down to one of these four pillars.
Depending on your goals, business and industry, you may want to assess the different funnel analyses at different times.
1. Pageview funnel analysis
Pageview funnel analysis is about understanding how well your website content is performing.
It helps you enhance user experience, making visitors stay longer on your site. By identifying poor performing pages (pages with high exit rates), you can pinpoint areas that need optimisation for better engagement.
2. Conversion funnel analysis
Next up, we’re looking at conversion funnel analysis.
This type of funnel analysis is crucial for marketers aiming to turn website visitors into action-takers. This involves tracking and optimising conversion goals, such as signing up for newsletters, downloading ebooks, submitting forms or signing up for free trials.
The primary goal of conversion funnel analysis is to boost your website’s overall conversion rates.
3. E-commerce funnel analysis
For businesses selling products online, e-commerce funnel analysis is essential.
It involves measuring whether your products are being purchased and finding drop-off points in the purchasing process.
By optimising the e-commerce funnel, you can enhance revenue and improve the overall efficiency of your sales process.
How to conduct funnel analysis
Now that you understand what funnel analysis is, why it’s important, and the different types of analysis, it’s time to show you how to do it yourself.
To get started with funnel analysis, you need to have the right web analytics solution.
Here are the most common funnel analysis tools and methods you can use :
1. Funnel analytics
If you want to choose a single tool to conduct funnel analysis, it’s an all-in-one web analytics tool, like Matomo.

With Matomo’s Funnel Analytics, you can dive into your whole funnel and analyse each step (and each step’s conversion rate).

For instance, if you look at the example above, you can see the proceed rate at each funnel step before the conversion page.
This means you can improve each proceed rate, to drive more traffic to your conversion page in order to increase conversion rates.
In the above snapshot from Matomo, it shows visitors starting on the job board overview page, moving on to view specific job listings. The goal is to convert these visitors into job applicants.
However, a significant issue arises at the job view stage, where 95% of visitors don’t proceed to job application. To increase conversions, we need to first concentrate on improving the job view page.
Try Matomo for Free
Get the web insights you need, without compromising data accuracy.
2. Heatmaps
Heatmaps is a behaviour analytics tool that lets you see different visitor activities, including :
- Mouse movement
- How far down visitors scroll
- Clicks
You can see which elements were clicked on and which weren’t and how far people scroll down your page.

A heatmap lets you see which parts of a page are getting the most attention and which parts go unnoticed by your users.
For example, if, during your funnel analysis, you see that a lot of visitors are falling off after they land on the checkout page, then you might want to add a heatmap on your checkout page to see where and why people are exiting.
3. Session recordings
Want to see what individual users are doing and how they’re interacting with your site ?
Then, you’ll want to check out session recordings.
A session recording is a video playback of a visitor’s time on your website.

It’s the most effective method to observe your visitors’ interactions with your site, eliminating uncertainty when identifying areas for funnel improvement.
Session recordings instill confidence in your optimisation efforts by providing insights into why and where visitors may be dropping off in the funnel.
4. A/B testing
If you want to take the guesswork out of optimising your funnel and increasing your conversions, you need to start A/B testing.
An A/B test is where you create two versions of a web page to determine which one converts better.

For example, if your heatmaps and session recordings show that your users are dropping off near your call to action, it may be time to test a new version.
You may find that by simply testing a different colour button, you may increase conversions by 20% or more.
5. Form analytics
Are you trying to get more leads to fill out forms on your site ?
Well, Form Analytics can help you understand how your website visitors interact with your signup forms.
You can view metrics such as starter rate, conversion rate, average hesitation time and average time spent.
This information allows you to optimise your forms effectively, ultimately maximising your success.
Let’s look at the performance of a form using Matomo’s Form Analytics feature below.

In the Matomo example, our starter rate stands at a solid 60.1%, but there’s a significant drop to a submitter rate of 29.3%, resulting in a conversion rate of 16.3%.
Looking closer, people are hesitating for about 16.2 seconds and taking nearly 1 minute 39 seconds on average to complete our form.
This could indicate our form is confusing and requesting too much. Simplifying it could help increase sign-ups.
See first-hand how Concrete CMS tripled their leads using Form Analytics in Matomo.
Try Matomo for Free
Get the web insights you need, without compromising data accuracy.
Start optimising your funnels with Matomo today
If you want to optimise your business, you must optimise your funnels.
Without information on what’s working and what’s not, you’ll never know if your website changes are making a difference.
Worse yet, you could have underperforming stages in your funnel, but you won’t know unless you start looking.
Funnel analysis changes that.
By analysing your funnels regularly, you’ll be able to see where visitors are leaking out of your funnel. That way, you can get more visitors to convert without generating more traffic.
If you want to improve conversions and grow revenue today, try Matomo’s Funnel Analytics feature.
You’ll be able to see conversion rates, drop-offs, and fine-tuned details on each step of your funnel so you can turn more potential customers into paying customers.
Additionally, Matomo comes equipped with features like heatmaps, session recordings, A/B testing, and form analytics to optimise your funnels with confidence.
Try Matomo free for 21-days. No credit card required.
Try Matomo for Free
21 day free trial. No credit card required.
-
Lean Analytics in a Privacy-First Environment – Bootcamp with Timo Dechau
29 novembre 2024, par Daniel Crough — Banking and Financial Services, GDPR, Marketing, Privacy, Videos, Featured Banking ContentIn a recent bootcamp, Timo Dechau walked attendees through his approach to data and measurement in privacy-focused analytics environments. He demonstrates how to shift from a chaotic, ‘track-it-all’ mentality to a focused method that prioritizes quality over quantity. This post will summarize some of his key privacy-first analytics ideas, but be sure to check out the on-demand video for more detail.
Watch the bootcamp on demand
<script type="text/javascript">var gform;gform||(document.addEventListener("gform_main_scripts_loaded",function(){gform.scriptsLoaded=!0}),window.addEventListener("DOMContentLoaded",function(){gform.domLoaded=!0}),gform={domLoaded:!1,scriptsLoaded:!1,initializeOnLoaded:function(o){gform.domLoaded&&gform.scriptsLoaded?o():!gform.domLoaded&&gform.scriptsLoaded?window.addEventListener("DOMContentLoaded",o):document.addEventListener("gform_main_scripts_loaded",o)},hooks:{action:{},filter:{}},addAction:function(o,n,r,t){gform.addHook("action",o,n,r,t)},addFilter:function(o,n,r,t){gform.addHook("filter",o,n,r,t)},doAction:function(o){gform.doHook("action",o,arguments)},applyFilters:function(o){return gform.doHook("filter",o,arguments)},removeAction:function(o,n){gform.removeHook("action",o,n)},removeFilter:function(o,n,r){gform.removeHook("filter",o,n,r)},addHook:function(o,n,r,t,i){null==gform.hooks[o][n]&&(gform.hooks[o][n]=[]);var e=gform.hooks[o][n];null==i&&(i=n+"_"+e.length),gform.hooks[o][n].push({tag:i,callable:r,priority:t=null==t?10:t})},doHook:function(n,o,r){var t;if(r=Array.prototype.slice.call(r,1),null!=gform.hooks[n][o]&&((o=gform.hooks[n][o]).sort(function(o,n){return o.priority-n.priority}),o.forEach(function(o){"function"!=typeof(t=o.callable)&&(t=window[t]),"action"==n?t.apply(null,r):r[0]=t.apply(null,r)})),"filter"==n)return r[0]},removeHook:function(o,n,t,i){var r;null!=gform.hooks[o][n]&&(r=(r=gform.hooks[o][n]).filter(function(o,n,r){return!!(null!=i&&i!=o.tag||null!=t&&t!=o.priority)}),gform.hooks[o][n]=r)}});</script><script><br />
gform.initializeOnLoaded( function() {gformInitSpinner( 72, 'https://matomo.org/wp-content/plugins/gravityforms/images/spinner.svg', true );jQuery('#gform_ajax_frame_72').on('load',function(){var contents = jQuery(this).contents().find('*').html();var is_postback = contents.indexOf('GF_AJAX_POSTBACK') >= 0;if(!is_postback){return;}var form_content = jQuery(this).contents().find('#gform_wrapper_72');var is_confirmation = jQuery(this).contents().find('#gform_confirmation_wrapper_72').length > 0;var is_redirect = contents.indexOf('gformRedirect(){') >= 0;var is_form = form_content.length > 0 && ! is_redirect && ! is_confirmation;var mt = parseInt(jQuery('html').css('margin-top'), 10) + parseInt(jQuery('body').css('margin-top'), 10) + 100;if(is_form){jQuery('#gform_wrapper_72').html(form_content.html());if(form_content.hasClass('gform_validation_error')){jQuery('#gform_wrapper_72').addClass('gform_validation_error');} else {jQuery('#gform_wrapper_72').removeClass('gform_validation_error');}setTimeout( function() { /* delay the scroll by 50 milliseconds to fix a bug in chrome */ }, 50 );if(window['gformInitDatepicker']) {gformInitDatepicker();}if(window['gformInitPriceFields']) {gformInitPriceFields();}var current_page = jQuery('#gform_source_page_number_72').val();gformInitSpinner( 72, 'https://matomo.org/wp-content/plugins/gravityforms/images/spinner.svg', true );jQuery(document).trigger('gform_page_loaded', [72, current_page]);window['gf_submitting_72'] = false;}else if(!is_redirect){var confirmation_content = jQuery(this).contents().find('.GF_AJAX_POSTBACK').html();if(!confirmation_content){confirmation_content = contents;}setTimeout(function(){jQuery('#gform_wrapper_72').replaceWith(confirmation_content);jQuery(document).trigger('gform_confirmation_loaded', [72]);window['gf_submitting_72'] = false;wp.a11y.speak(jQuery('#gform_confirmation_message_72').text());}, 50);}else{jQuery('#gform_72').append(contents);if(window['gformRedirect']) {gformRedirect();}}jQuery(document).trigger("gform_pre_post_render", [{ formId: "72", currentPage: "current_page", abort: function() { this.preventDefault(); } }]); if (event.defaultPrevented) { return; } const gformWrapperDiv = document.getElementById( "gform_wrapper_72" ); if ( gformWrapperDiv ) { const visibilitySpan = document.createElement( "span" ); visibilitySpan.id = "gform_visibility_test_72"; gformWrapperDiv.insertAdjacentElement( "afterend", visibilitySpan ); } const visibilityTestDiv = document.getElementById( "gform_visibility_test_72" ); let postRenderFired = false; function triggerPostRender() { if ( postRenderFired ) { return; } postRenderFired = true; jQuery( document ).trigger( 'gform_post_render', [72, current_page] ); gform.utils.trigger( { event: 'gform/postRender', native: false, data: { formId: 72, currentPage: current_page } } ); if ( visibilityTestDiv ) { visibilityTestDiv.parentNode.removeChild( visibilityTestDiv ); } } function debounce( func, wait, immediate ) { var timeout; return function() { var context = this, args = arguments; var later = function() { timeout = null; if ( !immediate ) func.apply( context, args ); }; var callNow = immediate && !timeout; clearTimeout( timeout ); timeout = setTimeout( later, wait ); if ( callNow ) func.apply( context, args ); }; } const debouncedTriggerPostRender = debounce( function() { triggerPostRender(); }, 200 ); if ( visibilityTestDiv && visibilityTestDiv.offsetParent === null ) { const observer = new MutationObserver( ( mutations ) => { mutations.forEach( ( mutation ) => { if ( mutation.type === 'attributes' && visibilityTestDiv.offsetParent !== null ) { debouncedTriggerPostRender(); observer.disconnect(); } }); }); observer.observe( document.body, { attributes: true, childList: false, subtree: true, attributeFilter: [ 'style', 'class' ], }); } else { triggerPostRender(); } } );} );<br />
</script>
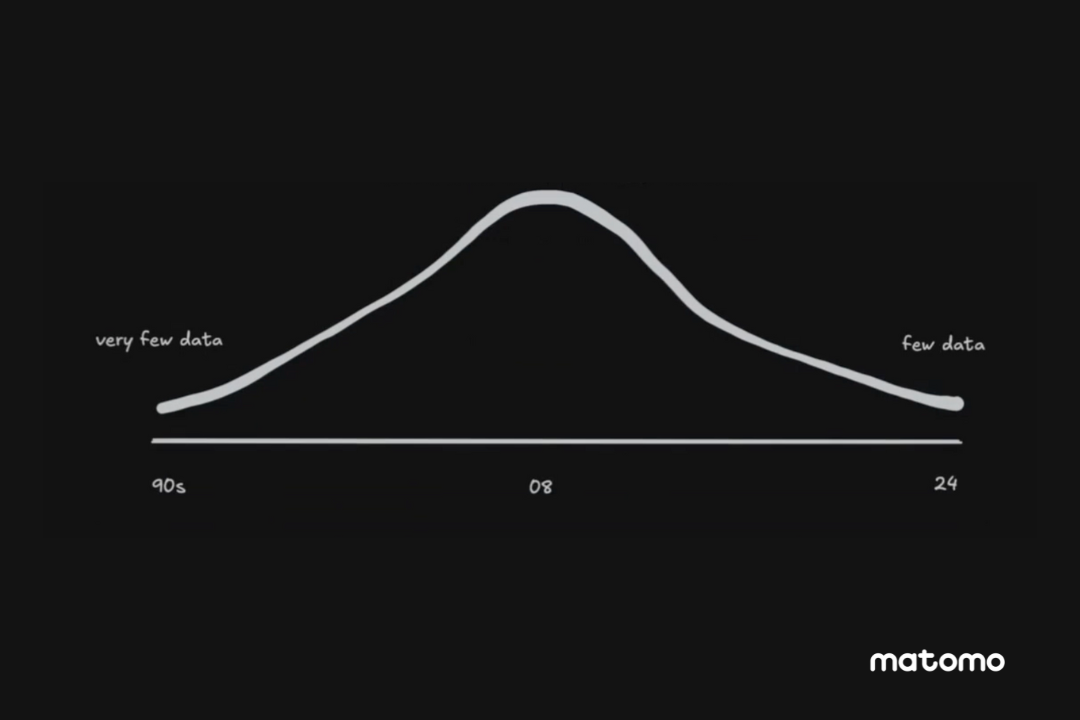
Unrestrained data collection leads to data bloat
Marketing and the business world are experiencing a data problem. Analysts and business intelligence teams grapple with large amounts of data that aren’t always useful and are often incomplete. The idea that “more data is better” became a guiding principle in the early 2000s, encouraging companies to gather everything possible using all available data collection methods. This unrestrained pursuit often led to an unexpected problem : data bloat. Too much data, too little clarity. Digital marketers, analysts, and business leaders now try to navigate vast amounts of information that create more confusion than insight, especially when the data is incomplete due to privacy regulations.

Cutting through the noise, focusing on what matters
The “more data is better” mindset emerged when digital marketers were beginning to understand data’s potential. It seemed logical : more data should mean more opportunities to optimise, personalise, and drive results. But in practice, gathering every possible piece of data often leads to a cluttered, confusing pile of metrics that can mislead more than guide.
This approach carries hidden costs. Excessive data collection burns resources, increases privacy concerns, and leaves teams unfocused. It’s easy to get lost trying to make sense of endless dashboards, metrics, and reports. More data doesn’t necessarily lead to better decisions ; it often just leads to more noise, hindering effective data management.
Rethinking data management : From data overload to data mindfulness
Data management has often prioritised comprehensive data gathering without considering the specific value of each data point. This approach has created more information, but not necessarily better insights.
Data mindfulness is about taking a deliberate, focused approach to data collection and analysis. Instead of trying to collect everything, it emphasises gathering only what truly adds value. It’s about ensuring the data you collect serves a purpose and directly contributes to better insights and data-driven decision-making.
Think of it like applying a “lean” methodology to data—trimming away the unnecessary and keeping only what is essential. Or consider embracing data minimalism to declutter your data warehouse, keeping only what truly sparks insight.

Mindful data is ethical data
Adopting a mindful approach to data can pay off in several ways :
-
Reduces overwhelm : When you reduce the clutter, you’re left with fewer, clearer metrics that lead to stronger decisions and actionable data insights.
-
Mitigates compliance risks : By collecting less, companies align better with privacy regulations and build trust with their customers. Privacy-first analytics and privacy-compliant analytics practices mean there’s no need for invasive tracking if it doesn’t add value—and customers will appreciate that.
-
Enhances data ethics : Focusing on the quality rather than the quantity of data collected ensures ethical data collection and management. Companies use data responsibly, respect user privacy, and minimise unnecessary data handling, strengthening customer relationships and brand integrity.
-
Improves data efficiency : Focused analytics means better use of resources. You’re spending less time managing meaningless metrics and more time working on meaningful insights. Many companies have found success by switching to a leaner, quality-first data approach, reporting sharper, more impactful results.
Shifting towards simplicity and lean analytics
If data mindfulness sounds appealing, here’s how you can get started :
-
Ask the right questions. Before collecting any data, ask yourself : Why are we collecting this ? How will it drive value ? If you can’t answer these questions clearly, that data probably isn’t worth collecting. This is a key step in smart data management.
-
Simplify metrics. Focus on the KPIs that truly matter for your business. Choose a handful of key metrics that reflect your goals rather than a sprawling list of nice-to-haves. Embracing data simplicity helps in targeting data collection effectively.
-
Audit your current data. Review your existing data collection processes. Which metrics are you actively using to make decisions ? Eliminate any redundant or low-value metrics that create noise. Use ethical data management practices to ensure data efficiency and compliance. Understanding what is data management in this context is crucial.
-
Implement lean analytics practices. Shift towards lean analytics by cutting down on unnecessary tracking. This can involve reducing reliance on multiple tracking scripts, simplifying your reporting, and setting up a streamlined dashboard focused on key outcomes. Embrace data reduction strategies to eliminate waste and boost effectiveness.
Who should watch this bootcamp
This bootcamp is perfect for data analysts, product managers, digital marketers and business leaders who are seeking a more streamlined approach to data measurement. If you’re interested in moving away from a chaotic “track-it-all” mentality and towards a focused, lean, and privacy-first analytics strategy, this workshop is for you.
What you’ll discover
-
Practical steps : Learn actionable strategies to reduce data bloat and implement lean, privacy-first analytics in your organisation.
-
Real-life examples : Explore case studies of companies that have successfully adopted focused and privacy-first analytics.
-
Deep insights : Gain a deeper understanding of how to prioritise quality over quantity without sacrificing valuable insights.
Watch the bootcamp on-demand
For a comprehensive dive into these topics, watch the full workshop video or download the detailed transcript. Equip yourself with the knowledge and tools to transform your data management approach today.
<script><br />
gform.initializeOnLoaded( function() {gformInitSpinner( 72, 'https://matomo.org/wp-content/plugins/gravityforms/images/spinner.svg', true );jQuery('#gform_ajax_frame_72').on('load',function(){var contents = jQuery(this).contents().find('*').html();var is_postback = contents.indexOf('GF_AJAX_POSTBACK') >= 0;if(!is_postback){return;}var form_content = jQuery(this).contents().find('#gform_wrapper_72');var is_confirmation = jQuery(this).contents().find('#gform_confirmation_wrapper_72').length > 0;var is_redirect = contents.indexOf('gformRedirect(){') >= 0;var is_form = form_content.length > 0 && ! is_redirect && ! is_confirmation;var mt = parseInt(jQuery('html').css('margin-top'), 10) + parseInt(jQuery('body').css('margin-top'), 10) + 100;if(is_form){jQuery('#gform_wrapper_72').html(form_content.html());if(form_content.hasClass('gform_validation_error')){jQuery('#gform_wrapper_72').addClass('gform_validation_error');} else {jQuery('#gform_wrapper_72').removeClass('gform_validation_error');}setTimeout( function() { /* delay the scroll by 50 milliseconds to fix a bug in chrome */ }, 50 );if(window['gformInitDatepicker']) {gformInitDatepicker();}if(window['gformInitPriceFields']) {gformInitPriceFields();}var current_page = jQuery('#gform_source_page_number_72').val();gformInitSpinner( 72, 'https://matomo.org/wp-content/plugins/gravityforms/images/spinner.svg', true );jQuery(document).trigger('gform_page_loaded', [72, current_page]);window['gf_submitting_72'] = false;}else if(!is_redirect){var confirmation_content = jQuery(this).contents().find('.GF_AJAX_POSTBACK').html();if(!confirmation_content){confirmation_content = contents;}setTimeout(function(){jQuery('#gform_wrapper_72').replaceWith(confirmation_content);jQuery(document).trigger('gform_confirmation_loaded', [72]);window['gf_submitting_72'] = false;wp.a11y.speak(jQuery('#gform_confirmation_message_72').text());}, 50);}else{jQuery('#gform_72').append(contents);if(window['gformRedirect']) {gformRedirect();}}jQuery(document).trigger("gform_pre_post_render", [{ formId: "72", currentPage: "current_page", abort: function() { this.preventDefault(); } }]); if (event.defaultPrevented) { return; } const gformWrapperDiv = document.getElementById( "gform_wrapper_72" ); if ( gformWrapperDiv ) { const visibilitySpan = document.createElement( "span" ); visibilitySpan.id = "gform_visibility_test_72"; gformWrapperDiv.insertAdjacentElement( "afterend", visibilitySpan ); } const visibilityTestDiv = document.getElementById( "gform_visibility_test_72" ); let postRenderFired = false; function triggerPostRender() { if ( postRenderFired ) { return; } postRenderFired = true; jQuery( document ).trigger( 'gform_post_render', [72, current_page] ); gform.utils.trigger( { event: 'gform/postRender', native: false, data: { formId: 72, currentPage: current_page } } ); if ( visibilityTestDiv ) { visibilityTestDiv.parentNode.removeChild( visibilityTestDiv ); } } function debounce( func, wait, immediate ) { var timeout; return function() { var context = this, args = arguments; var later = function() { timeout = null; if ( !immediate ) func.apply( context, args ); }; var callNow = immediate && !timeout; clearTimeout( timeout ); timeout = setTimeout( later, wait ); if ( callNow ) func.apply( context, args ); }; } const debouncedTriggerPostRender = debounce( function() { triggerPostRender(); }, 200 ); if ( visibilityTestDiv && visibilityTestDiv.offsetParent === null ) { const observer = new MutationObserver( ( mutations ) => { mutations.forEach( ( mutation ) => { if ( mutation.type === 'attributes' && visibilityTestDiv.offsetParent !== null ) { debouncedTriggerPostRender(); observer.disconnect(); } }); }); observer.observe( document.body, { attributes: true, childList: false, subtree: true, attributeFilter: [ 'style', 'class' ], }); } else { triggerPostRender(); } } );} );<br />
</script> -
-
A Guide to GDPR Sensitive Personal Data
13 mai 2024, par ErinThe General Data Protection Regulation (GDPR) is one of the world’s most stringent data protection laws. It provides a legal framework for collection and processing of the personal data of EU individuals.
The GDPR distinguishes between “special categories of personal data” (also referred to as “sensitive”) and other personal data and imposes stricter requirements on collection and processing of sensitive data. Understanding these differences will help your company comply with the requirements and avoid heavy penalties.
In this article, we’ll explain what personal data is considered “sensitive” according to the GDPR. We’ll also examine how a web analytics solution like Matomo can help you maintain compliance.
What is sensitive personal data ?
The following categories of data are treated as sensitive :
-
- Personal data revealing :
- Racial or ethnic origin ;
- Political opinions ;
- Religious or philosophical beliefs ;
- Trade union membership ;
- Genetic and biometric data ;
- Data concerning a person’s :
- Health ; or
- Sex life or sexual orientation.
- Personal data revealing :

Sensitive vs. non-sensitive personal data : What’s the difference ?
While both categories include information about an individual, sensitive data is seen as more private, or requiring a greater protection.
Sensitive data often carries a higher degree of risk and harm to the data subject, if the data is exposed. For example, a data breach exposing health records could lead to discrimination for the individuals involved. An insurance company could use the information to increase premiums or deny coverage.
In contrast, personal data like name or gender is considered less sensitive because it doesn’t carry the same degree of harm as sensitive data.
Unauthorised access to someone’s name alone is less likely to harm them or infringe on their fundamental rights and freedoms than an unauthorised access to their health records or biometric data. Note that financial information (e.g. credit card details) does not fall into the special categories of data.

Legality of processing
Under the GDPR, both sensitive and nonsensitive personal data are protected. However, the rules and conditions for processing sensitive data are more stringent.
Article 6 deals with processing of non-sensitive data and it states that processing is lawful if one of the six lawful bases for processing applies.
In contrast, Art. 9 of the GDPR states that processing of sensitive data is prohibited as a rule, but provides ten exceptions.
It is important to note that the lawful bases in Art. 6 are not the same as exceptions in Art. 9. For example, while performance of a contract or legitimate interest of the controller are a lawful basis for processing non-sensitive personal data, they are not included as an exception in Art. 9. What follows is that controllers are not permitted to process sensitive data on the basis of contract or legitimate interest.
The exceptions where processing of sensitive personal data is permitted (subject to additional requirements) are :
- Explicit consent : The individual has given explicit consent to processing their sensitive personal data for specified purpose(s), except where an EU member state prohibits such consent. See below for more information about explicit consent.
- Employment, social security or social protection : Processing sensitive data is necessary to perform tasks under employment, social security or social protection law.
- Vital interests : Processing sensitive data is necessary to protect the interests of a data subject or if the individual is physically or legally incapable of consenting.
- Non-for-profit bodies : Foundations, associations or nonprofits with a political, philosophical, religious or trade union aim may process the sensitive data of their members or those they are in regular contact with, in connection with their purposes (and no disclosure of the data is permitted outside the organisation, without the data subject’s consent).
- Made public : In some cases, it may be permissible to process the sensitive data of a data subject if the individual has already made it public and accessible.
- Legal claims : Processing sensitive data is necessary to establish, exercise or defend legal claims, including legal or in court proceedings.
- Public interest : Processing is necessary for reasons of substantial public interest, like preventing unlawful acts or protecting the public.
- Health or social care : Processing special category data is necessary for : preventative or occupational medicine, providing health and social care, medical diagnosis or managing healthcare systems.
- Public health : It is permissible to process sensitive data for public health reasons, like protecting against cross-border threats to health or ensuring the safety of medicinal products or medical devices.
- Archiving, research and statistics : You may process sensitive data if it’s done for archiving purposes in the public interest, scientific or historical research purposes or statistical purposes.
In addition, you must adhere to all data handling requirements set by the GDPR.
Important : Note that for any data sent that you are processing, you always need to identify a lawful basis under Art. 6. In addition, if the data sent contains sensitive data, you must comply with Art. 9.
Explicit consent
While consent is a valid lawful basis for processing non-sensitive personal data, controllers are permitted to process sensitive data only with an “explicit consent” of the data subject.
The GDPR does not define “explicit” consent, but it is accepted that it must meet all Art. 7 conditions for consent, at a higher threshold. To be “explicit” a consent requires a clear statement (oral or written) of the data subject. Consent inferred from the data subject’s actions does not meet the threshold.
The controller must retain records of the explicit consent and provide appropriate consent withdrawal method to allow the data subject to exercise their rights.
Examples of compliant and non-compliant sensitive data processing
Here are examples of when you can and can’t process sensitive data :
- When you can process sensitive data : A doctor logs sensitive data about a patient, including their name, symptoms and medicine prescribed. The hospital can process this data to provide appropriate medical care to their patients. An IoT device and software manufacturer processes their customers’ health data based on explicit consent of each customer.
- When you can’t process sensitive data : One example is when you don’t have explicit consent from a data subject. Another is when there’s no lawful basis for processing it or you are collecting personal data you simply do not need. For example, you don’t need your customer’s ethnic origin to fulfil an online order.
Other implications of processing sensitive data
If you process sensitive data, especially on a large scale, GDPR imposes additional requirements, such as having Data Privacy Impact Assessments, appointing Data Protection Officers and EU Representatives, if you are a controller based outside the EU.
Penalties for GDPR non-compliance
Mishandling sensitive data (or processing it when you’re not allowed to) can result in huge penalties. There are two tiers of GDPR fines :
- €10 million or 2% of a company’s annual revenue for less severe infringements
- €20 million or 4% of a company’s annual revenue for more severe infringements
In the first half of 2023 alone, fines imposed in the EU due to GDPR violations exceeded €1.6 billion, up from €73 million in 2019.
Examples of high-profile violations in the last few years include :
- Amazon : The Luxembourg National Commission fined the retail giant with a massive $887 million fine in 2021 for not processing personal data per the GDPR.
- Google : The National Data Protection Commission (CNIL) fined Google €50 million for not getting proper consent to display personalised ads.
- H&M : The Hamburg Commissioner for Data Protection and Freedom of Information hit the multinational clothing company with a €35.3 million fine in 2020 for unlawfully gathering and storing employees’ data in its service centre.
One of the criteria that affects the severity of a fine is “data category” — the type of personal data being processed. Companies need to take extra precautions with sensitive data, or they risk receiving more severe penalties.
What’s more, GDPR violations can negatively affect your brand’s reputation and cause you to lose business opportunities from consumers concerned about your data practices. 76% of consumers indicated they wouldn’t buy from companies they don’t trust with their personal data.
Organisations should lay out their data practices in simple terms and make this information easily accessible so customers know how their data is being handled.
Get started with GDPR-compliant web analytics
The GDPR offers a framework for securing and protecting personal data. But it also distinguishes between sensitive and non-sensitive data. Understanding these differences and applying the lawful basis for processing this data type will help ensure compliance.
Looking for a GDPR-compliant web analytics solution ?
At Matomo, we take data privacy seriously.
Our platform ensures 100% data ownership, putting you in complete control of your data. Unlike other web analytics solutions, your data remains solely yours and isn’t sold or auctioned off to advertisers.
Additionally, with Matomo, you can be confident in the accuracy of the insights you receive, as we provide reliable, unsampled data.
Matomo also fully complies with GDPR and other data privacy laws like CCPA, LGPD and more.
Start your 21-day free trial today ; no credit card required.
Disclaimer
We are not lawyers and don’t claim to be. The information provided here is to help give an introduction to GDPR. We encourage every business and website to take data privacy seriously and discuss these issues with your lawyer if you have any concerns.
Try Matomo for Free
21 day free trial. No credit card required.

-