Recherche avancée

Médias (0)

Mot : - Tags -/metadatas

Aucun média correspondant à vos critères n’est disponible sur le site.

Autres articles (46)

  • Websites made ​​with MediaSPIP

    2 mai 2011, par

    This page lists some websites based on MediaSPIP.

  • Creating farms of unique websites

    13 avril 2011, par

    MediaSPIP platforms can be installed as a farm, with a single "core" hosted on a dedicated server and used by multiple websites.
    This allows (among other things) : implementation costs to be shared between several different projects / individuals rapid deployment of multiple unique sites creation of groups of like-minded sites, making it possible to browse media in a more controlled and selective environment than the major "open" (...)

  • Submit bugs and patches

    13 avril 2011

    Unfortunately a software is never perfect.
    If you think you have found a bug, report it using our ticket system. Please to help us to fix it by providing the following information : the browser you are using, including the exact version as precise an explanation as possible of the problem if possible, the steps taken resulting in the problem a link to the site / page in question
    If you think you have solved the bug, fill in a ticket and attach to it a corrective patch.
    You may also (...)

Sur d’autres sites (6933)

  • A *hot* Piwik Community Meetup 2015 !

    10 août 2015, par André Bräkling — Community

    Last weekend I arrived in Germany to attend the Piwik Community Meetup 2015 and now I am in Poland.

    The meetup was HOT in every sense ! Berlin temperatures reached 35 degrees (celsius), as I finally meet in person several long-time, dedicated Piwik community contributors.

    Meetup preparation in Berlin, photo by M. Zawadziński, licensed under CC-BY-SA 4.0

    Pictures from the meetup preparation sessions

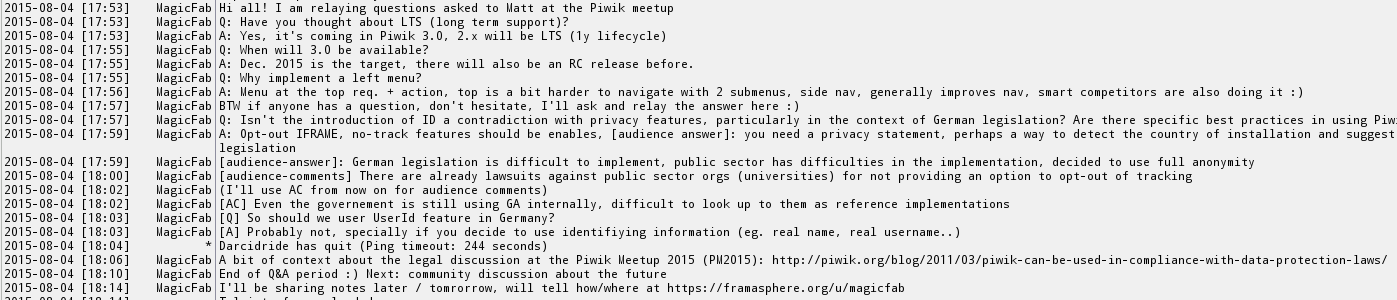
    In the first leg of my trip I was in Berlin to meet Piwik community members to prepare for the 2015 annual Piwik community meetup. These are my notes taken during the meeting at the request of one of my colleagues. I also relayed live on Framasphère, Twitter and IRC.

    Community discussion at the meetup, photo by D.Czajka, licensed under CC-BY-SA 4.0

    More pictures from the Piwik meetup

    This was harder than I expected, as I took notes with my laptop, pictures with my phone, wrote live to social media (using the Android Diaspora Native Web App), and used my laptop to relay on IRC. Going forward this requires better preparation, I was glad I had a few links and pictures ready before hand but it really requires intense focus to achieve this. I am glad presenters were patient when I requested repeating some of the ideas they shared. I am also a bit disappointed not much happened in IRC.

    Two day preparation sessions

    The discussions and session we had during the two days prior to the meetup are available here.

    We gathered in rented apartments in Berlin, this reminded me very much of similar community gatherings and perhaps of BarCamp and, at a much smaller scale, UDS sessions.

    Piwik Pizza !, photo by F. Rodríguez, licensed under CC-BY-SA 4.0

    A list of ideas of topics was initially submitted, we then proceeded to have scheduled sessions for open discussion. Several people shared their concern there was no possible remote participation which led to making public the Trello boards used/linked here.

    Note : The Trello links below still have action items and notes that are pending bug report / feature requests filing which should happen over the coming weeks. Most importantly, many action items will need identifying leads for different community team including Translations and Documentation, and better coordination of coming community engagement.

    Monday sessions consisted of the following subjects :

    On Tuesday we met again to discuss the following subjects :

    Some more details about individual preparation sessions

    What are Piwik values & how to communicate them ?

    The main subjects in this session were important changes proposed in the project mission and values. This was edited directly on on the wiki page on GitHub, some of the changes can be seen by comparing revisions.

    Piwik mission statement (bug #7376)

    “To create the leading Free and open source analytics platform, and to support global organisations and communities to keep full control over their data.”

    Our values

    • Openness
    • Freedom
    • Transparency
    • Data ownership
    • Privacy
    • Kaizen (改善) : continuous improvement

    This was also presented by Matthieu Aubry at the meetup and is published in the Roadmap page. Bringing more visibility and perhaps having a top page for Mission and Values was also brought up.

    Meetup agenda and notes

    The official agenda is available here.

    Many Piwik PRO employees stayed in Berlin for the meetup, and we had good participation although less than last year in Munich as my colleagues told me. Some were consultants, others staff from public organizations, universities, etc. In retrospect considering the very hot weather and summer holidays the attendance was good. I was very happy to arrive at the beautiful Kulturbrauerei and enter the air-conditioned Soda Club. T-Shirts were waiting for all attendees and free drinks (non-alcohol !) were welcome

  • 5-Step Conversion Rate Optimisation Checklist

    27 octobre 2023, par Erin

    Did you know the average conversion rate across e-commerce businesses in August 2023 was 2.03% ? In the past year, conversion rates have increased by 0.39%.

    Make no mistake. Just because conversion rates are higher this year doesn’t make it any easier to convert visitors.

    Cracking the secrets to improving conversion rates is crucial to running a successful website or business.

    Your site is the digital headquarters all of your marketing efforts funnel toward. With every visitor comes an opportunity to convert them into a lead (or sale).

    Keep reading if you want to improve your lead generation or convert more visitors into customers. In this article, we’ll break down a simple five-step conversion rate optimisation checklist you need to follow to maximise your conversions.

    What is conversion rate optimisation ?

    Before we dive into the steps you need to follow to optimise your conversions, let’s back up and talk conversion rate optimisation.

    Conversion rate optimisation, or CRO for short, is the process of increasing the number of website visitors who take a specific action. 

    In most cases, this means :

    • Turning more visitors into leads by getting them to join an email list
    • Convincing a visitor to fill out a contact form for a consultation
    • Converting a visitor into a paying customer by purchasing a product

    However, conversion rate optimisation can be used for any action you want someone to take on your site. That could be downloading a free guide, clicking on a specific link, commenting on a blog post or sharing your website with a friend.

    Why following a CRO checklist is important

    Conversion rate optimisation is both a valuable practice and an absolute necessity for any business or marketer. While it can be a bit complex, especially when you start diving into A/B testing, there are a variety of advantages :

    Get the most out of your efforts

    When all is said and done, if you can’t convert the traffic already coming to your site, dumping a ton of time and resources into traffic generation (whether paid or organic) won’t solve your problem.

    Instead, you need to look at the root of the problem : your conversion rate.

    By doubling down on conversions and following a conversion rate optimisation checklist, you’ll get the greatest result for the effort you’re already putting into your site.

    Increase audience size

    To increase your audience size, you need to increase your traffic, right ? Not exactly.

    While your audience may be considered people who have seen your content or follow you on social media, a high-value audience is one you can market to directly on an ongoing basis.

    Your website gives you the playground to convert visitors into high-value audience members. This is done by creating conversion-focused email signup forms and optimising your website for sale conversions.

    Generate more sales

    Boosting sales through CRO is the core objective. By optimising product pages, simplifying the checkout process, and employing persuasive strategies, you can systematically increase your sales and maximise the value of your existing traffic.

    Reduce customer acquisition costs (CAC)

    With conversion optimisation, you can convert a higher percentage of your website visitors into paid customers. Even if you don’t spend more on acquiring new customers, you’ll be able to generate more sales overall. 

    The result is that your customer acquisition costs will drop, allowing you to increase your total acquisitions to your customer base.

    Improve profitability

    While reduced customer acquisition costs mean you can pour more money into customer acquisition at a cheaper rate, you could simply maintain your costs while driving sales, resulting in increased profitability.

    If you can spend the same amount on acquisition but bring in 20% more customers (due to using a CRO checklist), your profit margins will automatically increase.

    5-step CRO checklist

    To double down on conversion rate optimisation, you need to follow a checklist to ensure you don’t miss any major optimisation opportunities.

    The checklist below is designed to help you systematically optimise your website, ensuring you make the most of your traffic by continuously refining its performance.

    1. Forms

    Analysing and optimising your website’s forms is crucial for enhancing conversion rates. Understanding how visitors interact with your forms can uncover pain points and help you streamline the conversion process.

    Ever wonder where your visitors drop off on your forms ? It could be due to lengthy, time-consuming fields or overly complex forms, leading to a frustrating user experience and lower conversion rate. Whatever the reason, you need the right tools to uncover the root of the issue.

    By leveraging Form Analytics, you gain powerful insights into user behaviour and can identify areas where people may encounter difficulties.

    Form Analytics provides the insights to discover :

    • Average time spent on each field : This metric helps you understand where users may be struggling or spending too much time. By optimising these fields, you can streamline the form, reduce user frustration and increase conversions.
    • Identifying drop-off points : Understanding where users drop off provides insights into which form fields may need improvement. Addressing these drop-off points can increase the conversion rate.
    • Unneeded fields with a high blank submission rate : Discovering fields left blank upon submission can highlight areas for simplification. By eliminating unnecessary fields, you can create more concise and user-friendly forms that may entice more visitors to engage with the form.

    Hear first-hand how Concrete CMS achieve 3x more leads with insights from Form Analytics. 

    These data-driven insights empower you to optimise your forms, remove guesswork and settle debates about form design. By fine-tuning and streamlining your forms, you can ensure a smoother path to conversion and maximise your success in converting more visitors.

    Try Matomo for Free

    Get the web insights you need, without compromising data accuracy.

    No credit card required

    2. Copywriting

    Another crucial element you need to test is your copywriting. Your copywriting is the foundation of your entire website. It helps communicate to your audience what you have to offer and why they need to take action.

    You need to ensure you have a good offer. This isn’t just the product or service you’re putting out there. It’s the complete package. It includes the product, rewards, a unique guarantee, customer service, packaging and promotions.

    Start testing your copy with your headlines. Look at the headers and test different phrases to convert more potential customers into paying customers.

    Here are a few tips to optimise your copy for more conversions :

    • Ensure copy is relevant to your headline and vice versa.
    • Write short words, short sentences and short paragraphs.
    • Use bullets and subheaders to make the copy easy to skim.
    • Don’t focus too heavily on optimising for search engines (SEO). Instead, write for humans.
    • Focus on writing about benefits, not features.
    • Write about how your offer solves the pain points of your audience.

    You can test your copy in several areas once you’ve begun testing your headers – your subheaders, body copy, signup forms and product pages (if you’re e-commerce).

    3. Media : videos and audio

    Next, testing out different media types is crucial. This means incorporating videos and audio into your content.

    Don’t just take a random guess by throwing stuff against the wall, hoping it sticks. Instead, you should use data to develop impactful content.

    Look at your Media Analytics reports in your website analytics solution and see what media people spend the most time on. See what kind of video or audio content already impacts conversions.

    Humans are highly visual. You should craft your content so it’s easy to digest. Instead of covering your website in huge chunks of text, split up your copy with engaging content like videos.

    High-quality videos and audio recordings allow your readers to consume more of your content easily, and help persuade them to take action on your site.

    4. Calls to action (CTA)

    This brings us to our next point : your call to action (CTA).

    Are you trying to convert more prospects into leads ? Want to turn more leads into customers ? Trying to get more email subscribers ? Or do you want to generate more sales every month ?

    You could write the most compelling offer flooded with beautiful images, videos and CRO tactics. But your efforts will go to waste if you don’t include a compelling CTA.

    An example of a CTA

    Here are a few tips to optimise your CTAs :

    • Keep them congruent on a single web page (e.g., don’t sell a hat and a sweater on the same page, as it can be confusing).
    • Place at least one CTA above the fold on your web pages.
    • Include benefits in your CTA. Rather than “Buy Now,” try “Buy Now to Get 30% Off.”
    • It’s better to be clear and concise than too fancy and unique.

    Optimising your call to action isn’t just about your copywriting. It’s also about design. Test different fonts, sizes, and visual elements like borders, icons and background colours.

    5. Web design

    Your site design will impact how well your visitors convert. You could have incredible copywriting, but if your site is laid out poorly, it will drive people away.

    You must ensure your copy and visual content fit your website design well.

    The first place you need to start with your site is your homepage design.

    Your site design consists of the theme or template, colour scheme and other visual elements that can be optimised to improve conversions.

    Here are a few tips to keep in mind when optimising your website design :

    • Use a colour scheme that’s pleasant rather than too distracting or extreme.
    • Ensure your design doesn’t remove the text’s clarity but makes it easier to read.
    • When in doubt, start with black text on a white background (the opposite rarely works).
    • Keep plenty of whitespace in between design elements.
    • When in doubt about font size, start by testing a larger size.
    • Design mobile-first rather than desktop-first.

    Finally, it’s critical to ensure your website is easy to navigate. Good design is all about the user experience. Is it easy to find what they’re looking for ? Simplify steps to reduce the need to click, and your conversions will increase.

    Start optimising your website for conversions

    If you’re looking to get the most out of the traffic on your site by converting more visitors into leads or customers, following this 5-step CRO checklist will help you take steps in the right direction.

    Just remember conversion rate optimisation is an ongoing process. It’s not a one-time deal. To succeed, you need to test quickly, analyse the impact and do more of what’s working and less of what’s not.

    To optimise your website for better conversion rates, you need the right tools that provide accurate data and insights to effectively increase conversions. With Matomo, you gain access to web analytics and CRO features like Form Analytics and Media Analytics, designed to enhance your conversion rate optimisation efforts. 

    Try Matomo free for 21 days and take your conversion rate to the next level. No credit card required.

  • How to Choose the Optimal Multi-Touch Attribution Model for Your Organisation

    13 mars 2023, par Erin — Analytics Tips

    If you struggle to connect the dots on your customer journeys, you are researching the correct solution. 

    Multi-channel attribution models allow you to better understand the users’ paths to conversion and identify key channels and marketing assets that assist them.

    That said, each attribution model has inherent limitations, which make the selection process even harder.

    This guide explains how to choose the optimal multi-touch attribution model. We cover the pros and cons of popular attribution models, main evaluation criteria and how-to instructions for model implementation. 

    Pros and Cons of Different Attribution Models 

    Types of Attribution Models

    First Interaction 

    First Interaction attribution model (also known as first touch) assigns full credit to the conversion to the first channel, which brought in a lead. However, it doesn’t report other interactions the visitor had before converting.

    Marketers, who are primarily focused on demand generation and user acquisition, find the first touch attribution model useful to evaluate and optimise top-of-the-funnel (ToFU). 

    Pros 

    • Reflects the start of the customer journey
    • Shows channels that bring in the best-qualified leads 
    • Helps track brand awareness campaigns

    Cons 

    • Ignores the impact of later interactions at the middle and bottom of the funnel 
    • Doesn’t provide a full picture of users’ decision-making process 

    Last Interaction 

    Last Interaction attribution model (also known as last touch) shifts the entire credit allocation to the last channel before conversion. But it doesn’t account for the contribution of all other channels. 

    If your focus is conversion optimization, the last-touch model helps you determine which channels, assets or campaigns seal the deal for the prospect. 

    Pros 

    • Reports bottom-of-the-funnel events
    • Requires minimal data and configurations 
    • Helps estimate cost-per-lead or cost-per-acquisition

    Cons 

    • No visibility into assisted conversions and prior visitor interactions 
    • Overemphasise the importance of the last channel (which can often be direct traffic) 

    Last Non-Direct Interaction 

    Last Non-Direct attribution excludes direct traffic from the calculation and assigns the full conversion credit to the preceding channel. For example, a paid ad will receive 100% of credit for conversion if a visitor goes directly to your website to buy a product. 

    Last Non-Direct attribution provides greater clarity into the bottom-of-the-funnel (BoFU). events. Yet, it still under-reports the role other channels played in conversion. 

    Pros 

    • Improved channel visibility, compared to Last-Touch 
    • Avoids over-valuing direct visits
    • Reports on lead-generation efforts

    Cons 

    • Doesn’t work for account-based marketing (ABM) 
    • Devalues the quality over quantity of leads 

    Linear Model

    Linear attribution model assigns equal credit for a conversion to all tracked touchpoints, regardless of their impact on the visitor’s decision to convert.

    It helps you understand the full conversion path. But this model doesn’t distinguish between the importance of lead generation activities versus nurturing touches.

    Pros 

    • Focuses on all touch points associated with a conversion 
    • Reflects more steps in the customer journey 
    • Helps analyse longer sales cycles

    Cons 

    • Doesn’t accurately reflect the varying roles of each touchpoint 
    • Can dilute the credit if too many touchpoints are involved 

    Time Decay Model 

    Time decay models assumes that the closer a touchpoint is to the conversion, the greater its influence. Pre-conversion touchpoints get the highest credit, while the first ones are ranked lower (5%-5%-10%-15%-25%-30%).

    This model better reflects real-life customer journeys. However, it devalues the impact of brand awareness and demand-generation campaigns. 

    Pros 

    • Helps track longer sales cycles and reports on each touchpoint involved 
    • Allows customising the half-life of decay to improve reporting 
    • Promotes conversion optimization at BoFu stages

    Cons 

    • Can prompt marketers to curtail ToFU spending, which would translate to fewer qualified leads at lower stages
    • Doesn’t reflect highly-influential events at earlier stages (e.g., a product demo request or free account registration, which didn’t immediately lead to conversion)

    Position-Based Model 

    Position-Based attribution model (also known as the U-shaped model) allocates the biggest credit to the first and the last interaction (40% each). Then distributes the remaining 20% across other touches. 

    For many marketers, that’s the preferred multi-touch attribution model as it allows optimising both ToFU and BoFU channels. 

    Pros 

    • Helps establish the main channels for lead generation and conversion
    • Adds extra layers of visibility, compared to first- and last-touch attribution models 
    • Promotes budget allocation toward the most strategic touchpoints

    Cons 

    • Diminishes the importance of lead nurturing activities as more credit gets assigned to demand-gen and conversion-generation channels
    • Limited flexibility since it always assigns a fixed amount of credit to the first and last touchpoints, and the remaining credit is divided evenly among the other touchpoints

    How to Choose the Right Multi-Touch Attribution Model For Your Business 

    If you’re deciding which attribution model is best for your business, prepare for a heated discussion. Each one has its trade-offs as it emphasises or devalues the role of different channels and marketing activities.

    To reach a consensus, the best strategy is to evaluate each model against three criteria : Your marketing objectives, sales cycle length and data availability. 

    Marketing Objectives 

    Businesses generate revenue in many ways : Through direct sales, subscriptions, referral fees, licensing agreements, one-off or retainer services. Or any combination of these activities. 

    In each case, your marketing strategy will look different. For example, SaaS and direct-to-consumer (DTC) eCommerce brands have to maximise both demand generation and conversion rates. In contrast, a B2B cybersecurity consulting firm is more interested in attracting qualified leads (as opposed to any type of traffic) and progressively nurturing them towards a big-ticket purchase. 

    When selecting a multi-touch attribution model, prioritise your objectives first. Create a simple scoreboard, where your team ranks various channels and campaign types you rely on to close sales. 

    Alternatively, you can survey your customers to learn how they first heard about your company and what eventually triggered their conversion. Having data from both sides can help you cross-validate your assumptions and eliminate some biases. 

    Then consider which model would best reflect the role and importance of different channels in your sales cycle. Speaking of which….

    Sales Cycle Length 

    As shoppers, we spend less time deciding on a new toothpaste brand versus contemplating a new IT system purchase. Factors like industry, business model (B2C, DTC, B2B, B2BC), and deal size determine the average cycle length in your industry. 

    Statistically, low-ticket B2C sales can happen within just several interactions. The average B2B decision-making process can have over 15 steps, spread over several months. 

    That’s why not all multi-touch attribution models work equally well for each business. Time-decay suits better B2B companies, while B2C usually go for position-based or linear attribution. 

    Data Availability 

    Businesses struggle with multi-touch attribution model implementation due to incomplete analytics data. 

    Our web analytics tool captures more data than Google Analytics. That’s because we rely on a privacy-focused tracking mechanism, which allows you to collect analytics without showing a cookie consent banner in markets outside of Germany and the UK. 

    Cookie consent banners are mandatory with Google Analytics. Yet, almost 40% of global consumers reject it. This results in gaps in your analytics and subsequent inconsistencies in multi-touch attribution reports. With Matomo, you can compliantly collect more data for accurate reporting. 

    Some companies also struggle to connect collected insights to individual shoppers. With Matomo, you can cross-attribute users across browning sessions, using our visitors’ tracking feature

    When you already know a user’s identifier (e.g., full name or email address), you can track their on-site behaviours over time to better understand how they interact with your content and complete their purchases. Quick disclaimer, though, visitors’ tracking may not be considered compliant with certain data privacy laws. Please consult with a local authority if you have doubts. 

    How to Implement Multi-Touch Attribution

    Multi-touch attribution modelling implementation is like a “seek and find” game. You have to identify all significant touchpoints in your customers’ journeys. And sometimes also brainstorm new ways to uncover the missing parts. Then figure out the best way to track users’ actions at those stages (aka do conversion and events tracking). 

    Here’s a step-by-step walkthrough to help you get started. 

    Select a Multi-Touch Attribution Tool 

    The global marketing attribution software is worth $3.1 billion. Meaning there are plenty of tools, differing in terms of accuracy, sophistication and price.

    To make the right call prioritise five factors :

    • Available models : Look for a solution that offers multiple options and allows you to experiment with different modelling techniques or develop custom models. 
    • Implementation complexity : Some providers offer advanced data modelling tools for creating custom multi-touch attribution models, but offer few out-of-the-box modelling options. 
    • Accuracy : Check if the shortlisted tool collects the type of data you need. Prioritise providers who are less dependent on third-party cookies and allow you to identify repeat users. 
    • Your marketing stack : Some marketing attribution tools come with useful add-ons such as tag manager, heatmaps, form analytics, user session recordings and A/B testing tools. This means you can collect more data for multi-channel modelling with them instead of investing in extra software. 
    • Compliance : Ensure that the selected multi-attribution analytics software wouldn’t put you at risk of GDPR non-compliance when it comes to user privacy and consent to tracking/analysis. 

    Finally, evaluate the adoption costs. Free multi-channel analytics tools come with data quality and consistency trade-offs. Premium attribution tools may have “hidden” licensing costs and bill you for extra data integrations. 

    Look for a tool that offers a good price-to-value ratio (i.e., one that offers extra perks for a transparent price). 

    Set Up Proper Data Collection 

    Multi-touch attribution requires ample user data. To collect the right type of insights you need to set up : 

    • Website analytics : Ensure that you have all tracking codes installed (and working correctly !) to capture pageviews, on-site actions, referral sources and other data points around what users do on page. 
    • Tags : Add tracking parameters to monitor different referral channels (e.g., “facebook”), campaign types (e.g., ”final-sale”), and creative assets (e.g., “banner-1”). Tags help you get a clearer picture of different touchpoints. 
    • Integrations : To better identify on-site users and track their actions, you can also populate your attribution tool with data from your other tools – CRM system, A/B testing app, etc. 

    Finally, think about the ideal lookback window — a bounded time frame you’ll use to calculate conversions. For example, Matomo has a default windows of 7, 30 or 90 days. But you can configure a custom period to better reflect your average sales cycle. For instance, if you’re selling makeup, a shorter window could yield better results. But if you’re selling CRM software for the manufacturing industry, consider extending it.

    Configure Goals and Events 

    Goals indicate your main marketing objectives — more traffic, conversions and sales. In web analytics tools, you can measure these by tracking specific user behaviours. 

    For example : If your goal is lead generation, you can track :

    • Newsletter sign ups 
    • Product demo requests 
    • Gated content downloads 
    • Free trial account registration 
    • Contact form submission 
    • On-site call bookings 

    In each case, you can set up a unique tag to monitor these types of requests. Then analyse conversion rates — the percentage of users who have successfully completed the action. 

    To collect sufficient data for multi-channel attribution modelling, set up Goal Tracking for different types of touchpoints (MoFU & BoFU) and asset types (contact forms, downloadable assets, etc). 

    Your next task is to figure out how users interact with different on-site assets. That’s when Event Tracking comes in handy. 

    Event Tracking reports notify you about specific actions users take on your website. With Matomo Event Tracking, you can monitor where people click on your website, on which pages they click newsletter subscription links, or when they try to interact with static content elements (e.g., a non-clickable banner). 

    Using in-depth user behavioural reports, you can better understand which assets play a key role in the average customer journey. Using this data, you can localise “leaks” in your sales funnel and fix them to increase conversion rates.

    Test and Validated the Selected Model 

    A common challenge of multi-channel attribution modelling is determining the correct correlation and causality between exposure to touchpoints and purchases. 

    For example, a user who bought a discounted product from a Facebook ad would act differently than someone who purchased a full-priced product via a newsletter link. Their rate of pre- and post-sales exposure will also differ a lot — and your attribution model may not always accurately capture that. 

    That’s why you have to continuously test and tweak the selected model type. The best approach for that is lift analysis. 

    Lift analysis means comparing how your key metrics (e.g., revenue or conversion rates) change among users who were exposed to a certain campaign versus a control group. 

    In the case of multi-touch attribution modelling, you have to monitor how your metrics change after you’ve acted on the model recommendations (e.g., invested more in a well-performing referral channel or tried a new brand awareness Twitter ad). Compare the before and after ROI. If you see a positive dynamic, your model works great. 

    The downside of this approach is that you have to invest a lot upfront. But if your goal is to create a trustworthy attribution model, the best way to validate is to act on its suggestions and then test them against past results. 

    Conclusion

    A multi-touch attribution model helps you measure the impact of different channels, campaign types, and marketing assets on metrics that matter — conversion rate, sales volumes and ROI. 

    Using this data, you can invest budgets into the best-performing channels and confidently experiment with new campaign types. 

    As a Matomo user, you also get to do so without breaching customers’ privacy or compromising on analytics accuracy.

    Start using accurate multi-channel attribution in Matomo. Get your free 21-day trial now. No credit card required.