Recherche avancée
Médias (1)
-

Bug de détection d’ogg
22 mars 2013, par
Mis à jour : Avril 2013
Langue : français
Type : Video
Autres articles (61)
-
Gestion générale des documents
13 mai 2011, parMédiaSPIP ne modifie jamais le document original mis en ligne.
Pour chaque document mis en ligne il effectue deux opérations successives : la création d’une version supplémentaire qui peut être facilement consultée en ligne tout en laissant l’original téléchargeable dans le cas où le document original ne peut être lu dans un navigateur Internet ; la récupération des métadonnées du document original pour illustrer textuellement le fichier ;
Les tableaux ci-dessous expliquent ce que peut faire MédiaSPIP (...) -
Les vidéos
21 avril 2011, parComme les documents de type "audio", Mediaspip affiche dans la mesure du possible les vidéos grâce à la balise html5 .
Un des inconvénients de cette balise est qu’elle n’est pas reconnue correctement par certains navigateurs (Internet Explorer pour ne pas le nommer) et que chaque navigateur ne gère en natif que certains formats de vidéos.
Son avantage principal quant à lui est de bénéficier de la prise en charge native de vidéos dans les navigateur et donc de se passer de l’utilisation de Flash et (...) -
Des sites réalisés avec MediaSPIP
2 mai 2011, parCette page présente quelques-uns des sites fonctionnant sous MediaSPIP.
Vous pouvez bien entendu ajouter le votre grâce au formulaire en bas de page.
Sur d’autres sites (6374)
-
A Quick Start Guide to the Payment Services Directive (PSD2)
22 novembre 2024, par Daniel Crough — Banking and Financial Services, Privacy


-
How to Check Website Traffic : A Complete Guide
26 février, par Daniel Crough — Analytics Tips, MarketingIf you want to learn about the health of your website and the success of your digital marketing initiatives, there are few better ways than checking your website traffic.
Checking website traffic is a great way to get a dopamine hit when things are up. And it’s a great way to troubleshoot problems when things go down. It’s also a critical data source for marketing and web teams. But to get the most out of it, you need reliable data sources, the ability to track them over time and a way to monitor the competition.
This article explains how to check website traffic (for your site and your competitors), explores nine tools that can help and discusses why some methods are better than others.
Why check website traffic ?
Dopamine hits aside, monitoring website traffic is crucial to a business — even for a primarily brick-and-mortar operation. In this internet age, customers and prospects are far more likely to research a company online before buying anything.
SOCi’s 2024 Consumer Behavior Index found that 8 in 10 US consumers use the internet to search for local businesses at least once a week. And Statista found that 55% of UK shoppers always do some online research before making a major purchase.
And trend lines suggest these numbers are likely to continue climbing. Businesses need to know what’s happening on their sites, and that’s difficult to achieve without traffic data.
Indeed, website data allows companies to better understand their target audiences, measure the effectiveness of marketing efforts and channels, and identify areas of the website that need work.
Let’s dig into those ideas in a little more detail.

Benchmark site performance
Keeping regular tabs on traffic levels is a great way to track a website’s performance over time. It can help with planning for the future and identifying current problems.
For instance, rising traffic levels may mean expanding the business’s offering or investing in more inventory. On the flip side, decreasing traffic levels may suggest it’s time to revamp marketing strategies or look into issues impacting SEO.
Analyse user behaviour
Checking website traffic, user behaviour, and other metrics shows marketing managers how users interact with the website. These traffic stats can help answer questions like :
- Which pages are users visiting ?
- Which CTAs are they clicking on ?
- Which page elements encourage users to take the desired actions ?
It can also identify issues contributing to high bounce rates or declines in search rankings.
The better user behaviour is understood, the easier it is to give visitors what they want. For example, the data could reveal that users spend more time on landing pages than blogs. These valuable insights can be used to optimise blog content and improve performance.
Improve the user experience
Once user behaviour is well understood, it’s easier to make adjustments, update content and improve the overall user experience. This also allows companies to create more personalised customer experiences, which can lead to growth. Research shows companies that get personalisation right generate 40% more revenue from those activities than average players.
That could take the form of sweeping changes like rearranging a website’s navigation bar based on user behaviour. It could also be personalisation that uses analytics to transform sections or entire pages based on individual user behaviour.
Optimise digital marketing strategies
Knowing current traffic levels and how they trend over time helps teams set benchmarks and prioritise marketing efforts.
Monthly traffic reports can inform SEO efforts and benefit marketing attribution. For example, they could indicate when the time is right to double down on organic traffic or when the better strategy would be to invest more in PPC advertising.
Increasing organic traffic levels from other countries can help businesses identify new marketing opportunities. If traffic levels from a neighbouring country or a growing market increase significantly, it could be time for a cross-border campaign.
Filter unwanted traffic
A significant chunk of every website’s traffic comes from bots and other unwanted sources. This can compromise the quality of website data and make it harder to draw useful insights. While it’s nearly impossible to get rid of this traffic completely, many analytics tools have features to filter it out of the stats.
Why check competitors’ website traffic
Websites are windows into businesses and their strategies. That’s why monitoring traffic and other metrics drawn from competitors is essential.
There’s a lot to learn from the competition, both good and bad. What competitors do well can be replicated, and learning from the elements they get wrong can help you avoid making the same mistakes.
- Strategic planning : Looking at traffic on specific pages can offer insight into potential marketing campaigns and highlight gaps in the market that may be worth attacking. Looking at their organic, paid, social and referral traffic levels can highlight opportunities for growth or pinpoint the reasons for success in a particular area.
- Benchmarking : Looking at website traffic in isolation can lack context. Monitoring other sites’ engagement metrics, like bounce rate and average session duration, can give you an inside look at the competition, which can help you set realistic performance goals and benchmarks.
- Product Development : Significant traffic volume on certain pages can indicate shifts in demand and market trends, which may inform the development of new products or services. For example, if a competitive dog food supplier ranks well for the term “organic dog food”, that might be something to consider when formulating new products.
- Audience demographics : Comparing audience demographics between competitors can highlight opportunities and help a business narrow down its target audience. This guides messaging and campaign strategies to capture specific audience segments.
- Keyword opportunities : Examining the keywords driving the most traffic to a competitor’s website can help you uncover untapped SEO potential for your website. Analysing top-performing content on competing sites can help identify content improvement strategies to pull traffic away from competitors.
- Partnerships : Referrals are an often overlooked traffic metric. High volumes of such traffic indicate successful partnerships between competitors and third parties, which is a model worth emulating.
7 key website traffic metrics to track
Traffic metrics are not a case of one-size-fits-all. Those that are important today may not be tomorrow. It all depends on the priorities and goals at any one moment. That said, there are a few traffic metrics that always matter to some degree.
- New visitors : These are users who have never visited the website before. They are a great sign that marketing efforts are working and the website is reaching more people. But it’s also important to track how they behave on the website to ensure the site caters effectively to the needs of new visitors.
- Returning visitors : Returning visitors are coming back to the website for a reason : either they like the content they find or want to buy something. Either way, it’s excellent news. The more returning visitors, the better.
- Bounce rate : This measures how many users leave the website without taking action. Different analytics tools measure this metric differently.
- Session duration : This is the time users spend on the website, which can reveal whether they find the site engaging. And when considered alongside the next metric, it can be especially insightful.
- Pages per session : This measures the average number of pages users visit on a website. The more pages they visit and the longer users spend on the website, the more engaging it is.
- Traffic source : Traffic can come from various sources (organic, direct, social media, referral, etc.). Knowing the highest sources of referral traffic can help analyse and prioritise marketing efforts.
- User demographics : This shows who visits a website, what device they use, what country they come from, etc. While most website traffic will come from the countries targeted by marketing, an influx of new users from other countries can open the door to new opportunities.
9 tools to check website traffic
There are thousands of different web analytics tools that can provide decent website traffic analysis and functionality checks. They all use a similar combination of sophisticated algorithms, data collection techniques, statistical analysis and machine learning to deliver insights into visitor behaviour and site performance.
Most web analytics tools work by embedding bits of JavaScript or other tracking codes into a website. When users land on a website, it gathers data such as page views, session duration, and specific interactions. Many also use cookies to identify returning visitors, which lets them monitor user behaviour over time.
Many tools offer advanced event-tracking functionality. This captures specific actions, like clicks or form submissions, and provides a more granular view of engagement. The data is then statistically analysed to spot trends and calculate key metrics like bounce rates and conversion rates.
Some web analytics tools use machine learning to predict future user behaviour based on historical patterns. Others aggregate data to provide insights via charts comparing website performance with selected competitors’ websites.
This section explores nine popular tools for checking website traffic and highlights their unique features and benefits.
1. Checking website traffic with Google Analytics
Google Analytics is usually the first place to start for anyone looking to check their website traffic. It’s free to use, incredibly popular and offers a wide range of traffic reports.
It breaks down historical traffic data in many different ways. It can split traffic by acquisition channel (organic, social media, direct, etc.), by country, device or demographic. It also provides real-time traffic reports that offer a snapshot of users on the site right now and over the last 30 minutes.

GA4’s Traffic acquisition report helps to understand where website and app visitors are coming from. Image source Google Analytics may be one of the most popular ways to check website traffic, but it could be better. Google Analytics 4 (GA4) is difficult to use compared to its predecessor, and it also imposes data tracking limits in accordance with privacy laws. If users refuse cookie consent, Google Analytics won’t record those visits. In other words, using Google Analytics alone doesn’t provide a complete view of the traffic.

GA4 can also help to pinpoint the pages and screens that receive the most traffic. Image source Also, GA4 relies on sampling when processing large datasets or complex queries. When the volume of data exceeds certain thresholds, it only considers a subset of the data to generate reports instead of processing every single data point.
There are pros and cons to this approach. While it speeds up analysis and reduces the load on the system, it can also lead to inaccuracies in insights delivered. When analysing traffic patterns over a busy period, GA4 may only use a portion of the data to calculate and then extrapolate metrics.
As a result, trends or anomalies might be overlooked or misconstrued, which could mean missed opportunities or poor decisions. That’s why it’s important to use Google Analytics alongside other web analytics tools (like Matomo) that don’t suffer from the same privacy issues. That way, it’s possible to track every single user who visits the website.
2. Checking website traffic with Google Search Console
Google Search Console is a free tool that analyses a website’s Google search traffic. The top-line report shows how many times the website has appeared in Google Search, how many clicks it has received, the average clickthrough rate and its average position in the search results.

Google Search Console can reveal keyword patterns and spikes in interest Image source It’s a great way to understand what the website ranks for and how much traffic organic rankings generate. It will also show which pages are indexed in Google and whether there are any crawling errors.
Unfortunately, Google Search Console is limited if a complete view of traffic is needed. While the search traffic can be analysed in great detail, it will not report how users who access the website behave on it.
3. Checking website traffic with Similarweb
Similarweb is a website analysis tool that estimates the total traffic of any site on the internet. It is one of the best traffic checker tools for estimating how much web traffic competitors receive.
What’s great about Similarweb is that it estimates total traffic, not just traffic from search engines like many SEO tools. It even breaks down traffic by different channels for easy comparison.

Similarweb’s dashboard reveals how traffic levels increase or decrease month-over-month. Image source Similarweb provides an estimate of total visits, bounce rate, the average number of pages users view per visit and the average duration on the site. The company also has a free browser extension that continues checking website traffic estimates while the user is browsing the web.
Similarweb is free to use, up to a point. However, to get the most out of this tool, you must upgrade to the premium plan, which starts at $125 per user per month.
The price isn’t Similarweb’s only downside. Ultimately, it provides reasonably accurate estimates but is no match for a comprehensive traffic analytics tool.
4. Checking website traffic with Semrush
Semrush is a collection of marketing solutions for online businesses. Its Traffic Analytics tool checks the website traffic of up to 100 sites and compares that data side-by-side. For each site, it reveals the top pages, the regions from which most of the traffic comes, and the locations from which the most referrals come.
Semrush also gathers insights into competitors’ audiences and their activity, especially activity that overlaps between the sites being checked. It extracts and analyses comprehensive data on organic and paid search, social media, and backlinks.

Semrush’s traffic analytics monitors traffic stats for competitor websites. Image source However, there are notable downsides. Semrush can be pricey, with plans starting at about $119.95 per month or $1,199.40 annually. This cost may be prohibitive for smaller businesses or freelancers. Still, a free version offers most of the functionality but with a limited number of daily reports.
5. Checking website traffic with Ahrefs
Ahrefs‘s biggest strength is its organic traffic estimation capabilities. It estimates monthly visits from Google worldwide, Google keywords in the top 100 that a website ranks for, and traffic value via equivalence to PPC.

Ahrefs’ SEO dashboard uses trend graphs to show how projects are performing. Image source Ahrefs bases its estimates on ranking data from a database of 12 billion keywords, which is why it is so powerful. It generates a detailed report that includes organic traffic estimates, backlink data, and top-performing keywords.
However, the numbers produced by Ahrefs are estimates based on the available data and won’t always be 100% accurate. This is particularly true for smaller or newer websites that lack the data volumes needed for accuracy.
It’s a great SEO marketing tool that’s free to use within certain limits, but there is some value in registering for a paid plan. There are several options, beginning with the $129 per month Lite plan and extending to the Enterprise Plan for $1,499 monthly.
6. Checking website traffic with Serpstat
Serpstat is an SEO solution that grew from a simple keyword research tool. It offers more comprehensive features to help businesses understand their website’s performance. It helps improve a site’s visibility through tools for rank tracking, keyword research, traffic checking, backlink analysis, and site auditing.

Serpstat’s Domain Analytics dashboard shows trends over a 12-month period. Image source It provides metrics like estimated monthly visits, traffic sources (organic, paid, and referral), and insights into top-performing pages. Serpstat also offers competitor analysis features that help to identify market trends and refine growth strategies. However, like Ahrefs, the numbers provided are estimates, which are only as good as the depth of data from which they are derived.
The free version is fine for basic analysis, but signing up for one of the paid plans is advisable for commercial use. Pricing ranges from $59 per month to a monthly fee of $479 for the Agency plan. There is an option to pay annually at a discount.
7. Checking website traffic with SEO PowerSuite
SEO PowerSuite also goes some distance beyond just website traffic checking. As the name implies, it’s a suite of tools to improve website rankings.

Rank Tracker’s SEO dashboard reveals organic session growth over time. Image source. There are four tools in the suite :
- Rank Tracker enables tracking a website’s search engine rankings across multiple keywords and search engines.
- WebSite Auditor offers SEO analysis of website pages and recommends actions to boost performance.
- SEO SpyGlass analyses a website’s backlink profile to highlight link-building possibilities that’d help improve performance.
- LinkAssistant helps identify websites suitable for link-building and recommends viable outreach opportunities.
SEO PowerSuite has a free plan and two premium plans with varying functionality. The monthly cost could be as much as $139.67, depending on the features needed. Annual pricing options are also available.
8. Checking website traffic with Ubersuggest
Ubersuggest is also an SEO-focused tool. It offers website traffic analysis, keyword rankings, backlink profiles, and competitor insights. These are packaged in reports that provide an overview of website traffic, including monthly organic traffic totals and the number of organic keywords the site ranks for. Ubersuggest also offers content suggestions.

Ubersuggest’s Domain Overview Dashboard provides an overview of a website’s traffic. Image source Like other tools in this category, Ubersuggest doesn’t collect comprehensive data, so its numbers are estimates. This means the accuracy can vary. However, it remains a solid choice for providing great insights and enhancing a website’s online presence.
Like many tools in this category, there is a free version to give potential customers a taste, which is restricted by volume more than features. The paid plans range from around $29 per month for one website on the individual plan to about $99 per month for 8-15 websites on the Enterprise plan. Discounted annual pricing is also an option.
9. Checking website traffic with MonsterInsights
MonsterInsights is a tool worth considering for websites built on WordPress because it’s not a website checking tool in the usual sense. It’s a WordPress plugin that simplifies the task by integrating Google Analytics directly into a website.
MonsterInsights then uses the raw data provided by GA4 to extract actionable insights based on audience preferences and activity. This makes it easier to focus on the relevant metrics for different types of websites. For example, the metrics used to measure a blog site would not be the same as those for an ecommerce site.
But there are some downsides, too. While the basic version is free, it has limited features, and the most potent functionality requires a premium subscription. Those start at $249 per year for a single site, or the Pro plan at $499 for up to five sites. Agencies looking to work with up to 25 sites are in for $999.

MonsterInsights’ Analytics Overview offers a snapshot of a website’s traffic volumes. Image source There’s another option
Although many of these tools have free versions, those tend to be heavily restricted, and premium plans can be expensive. A website has to generate serious revenue to deliver a decent return on investment (ROI) to justify the costs.
As more countries adopt GDPR-like privacy regulations, brands must ensure they’re using compliant, privacy-centric analytics tools.
Matomo Analytics is one such tool. It’s an ethical, open-source solution that helps you collect accurate data about your website’s traffic and make more informed decisions. This enhances the customer experience and ensures GDPR compliance and user privacy.
It’s completely free to install as an on-premise solution. Alternatively, there’s the subscription-based Matomo Cloud version.
How to check website traffic on Matomo
Apart from a better ROI picture, Matomo offers a more reliable assessment of your website’s traffic than Google Analytics 4. It also provides multiple ways to check organic search traffic :
- Visits log report
- Real-time visitor map
- Visits in real-time report
Let’s look at all of them one by one.
The visits log report is a unique rundown of your site’s visitors. It offers a much more granular view than other traffic checker tools, which only show the total number of visitors for a given period.

Matomo’s Visits Log Report provides a detailed breakdown of all website visitors. You can access the visits log report by clicking on the reporting menu and then clicking Visitor and Visits Log. From there, you’ll be able to scroll through every user session and see the following information :
- The location of the user
- The total number of actions they took
- The length of time on site
- How they arrived at your site
- The device they used to access your site
It may be overwhelming if your site receives thousands of visitors at a time. But it’s a great way to understand users at an individual level and appreciate the lifetime activity of specific users.
The Real-time visitor map shows site visitors’ location for a given timeframe. If you have an international website, it’s a fantastic way to see exactly where your traffic comes from.

Matomo’s Geo-Location dashboard reveals where website visitors are located. Image source You can access the Real-time Visitor Map by clicking Visitor in the main navigation menu and then Real-time Map. The map itself is colour-coded. Larger orange bubbles represent recent visits, and smaller dark orange and grey bubbles represent older visits. The map will refresh every five seconds, and new users appear with a flashing effect.
If you run TV or radio adverts, Matomo’s Real-time Map provides an immediate read on the effectiveness of your campaign. If your map lights up in the minutes following your ad, you know it’s been effective. It can also help you identify the source of bot attacks, too.
Finally, the Visits in Real-time report provides a snapshot of who is browsing your website. You can access this report under Visitors > Real-time and add it to your custom dashboards as a widget.
Open the report, and you’ll see the real-time flow of your site’s users and counters for visits and pageviews over the last 30 minutes and 24 hours. The report refreshes every five seconds with new users added to the top of the report with a fade-in effect.

Matomo’s Visits in Real-time report displays new visits or current visitors viewing a new page. Image source The report provides a snapshot of each visitor, including :
- Whether they are new or returning
- Their country
- Their browser
- Their operating system
- The number of actions they took
- The time they spent on the site
- The channel they came in from
- Whether the visitor converted a goal
Why do my traffic reports differ ?
If you use more than one of the methods above to check your website traffic, you’ll quickly realise that every traffic report differs. In some cases, the reasons are obvious. Any tool that estimates your traffic without adding code to your website is just that : an estimate. Tools like many of those mentioned here will never offer the accuracy of analytics platforms like Matomo and Google Analytics.
But what about the differences between these analytics platforms themselves ? While each platform records user behaviour differently, significant differences in website traffic reports between analytics platforms are usually due to how each platform handles user privacy.
A platform like Google Analytics requires users to accept a cookie consent banner to track them. If they accept, great. Google collects all of the data that any other analytics platform does. It may even collect more. However, if users reject cookie consent banners, Google Analytics can’t track them. They simply won’t show up in your traffic reports.
That doesn’t happen with all analytics platforms, however. A privacy-focused alternative like Matomo doesn’t require cookie consent banners (apart from in the United Kingdom and Germany). Therefore, it can continue to track visitors even after they have rejected a cookie consent screen from Google Analytics. This means virtually all website traffic will be tracked regardless of whether users accept a cookie consent banner. And it’s why traffic reports in Matomo are often much higher than in Google Analytics.

Many adults in the EU refuse to allow tracking for advertising purposes, and most reject cookies when they can. This means different analytics tools can offer vastly different traffic stats. Around half (47.32%) of adults in the European Union refuse to allow personal data tracking for advertising purposes, and 95% of people will reject additional cookies when it is easy to do so. So relying on cookies limits your results — and causes you to miss out on valuable user data.
If you’re serious about using web analytics to improve your website and optimise your marketing campaigns, then it is essential to use another analytics platform alongside Google Analytics.
What to do if website traffic levels drop
Experiencing a drop in website traffic can be frustrating, but it happens to everyone at some point. Here’s how to address it :
- Analyse traffic sources : Use analytics tools to pinpoint where the decline is coming from—organic search, referrals, or social media.
- Check for technical issues : Look for broken links or slow loading times, which can deter visitors. Tools like Google Search Console can help identify errors.
- Review recent changes : Consider any recent updates to the website. If something coincided with the drop, it might be worth reverting.
- Evaluate content quality : Ensure the content is engaging and relevant. Update or improve underperforming posts.
- Reassess the marketing strategy : The only constant in marketing is change. It’s wise to periodically revisit the balance between paid ads, social media and other vectors to evaluate their effectiveness and adjust the approach.
It’s perfectly normal for website traffic volumes to fluctuate. Expect it and work with the available tools. Persistence will likely see the traffic volumes rebound.
Get more accurate traffic reports with Matomo
There are several methods to check website traffic. Some can provide estimates on your competitors’ traffic levels. Others, like Google Analytics, are free. But data doesn’t lie. Only privacy-focused analytics solutions like Matomo can provide accurate reports that account for every visitor.
Join over one million organisations using Matomo to check their website traffic accurately and ethically.
Try Matomo for Free
Start your 21-day free trial — no credit card required.
-
Adventures In NAS
1er janvier, par Multimedia Mike — GeneralIn my post last year about my out-of-control single-board computer (SBC) collection which included my meager network attached storage (NAS) solution, I noted that :
I find that a lot of my fellow nerds massively overengineer their homelab NAS setups. I’ll explore this in a future post. For my part, people tend to find my homelab NAS solution slightly underengineered.
So here I am, exploring this is a future post. I’ve been in the home NAS game a long time, but have never had very elaborate solutions for such. For my part, I tend to take an obsessively reductionist view of what constitutes a NAS : Any small computer with a pool of storage and a network connection, running the Linux operating system and the Samba file sharing service.

Many home users prefer to buy turnkey boxes, usually that allow you to install hard drives yourself, and then configure the box and its services with a friendly UI. My fellow weird computer nerds often buy cast-off enterprise hardware and set up more resilient, over-engineered solutions, as long as they have strategies to mitigate the noise and dissipate the heat, and don’t mind the electricity bills.
If it works, awesome ! As an old hand at this, I am rather stuck in my ways, however, preferring to do my own stunts, both with the hardware and software solutions.
My History With Home NAS Setups
In 1998, I bought myself a new computer — beige box tower PC, as was the style as the time. This was when normal people only had one computer at most. It ran Windows, but I was curious about this new thing called “Linux” and learned to dual boot that. Later that year, it dawned on me that nothing prevented me from buying a second ugly beige box PC and running Linux exclusively on it. Further, it could be a headless Linux box, connected by ethernet, and I could consolidate files into a single place using this file sharing software named Samba.
I remember it being fairly onerous to get Samba working in those days. And the internet was not quite so helpful in those days. I recall that the thing that blocked me for awhile was needing to know that I had to specify an entry for the Samba server machine in the LMHOSTS (Lanman hosts) file on the Windows 95 machine.
However, after I cracked that code, I have pretty much always had some kind of ad-hoc home NAS setup, often combined with a headless Linux development box.
In the early 2000s, I built a new beige box PC for a file server, with a new hard disk, and a coworker tutored me on setting up a (P)ATA UDMA 133 (or was it 150 ? anyway, it was (P)ATA’s last hurrah before SATA conquered all) expansion card and I remember profiling that the attached hard drive worked at a full 21 MBytes/s reading. It was pretty slick. Except I hadn’t really thought things through. You see, I had a hand-me-down ethernet hub cast-off from my job at the time which I wanted to use. It was a 100 Mbps repeater hub, not a switch, so the catch was that all connected machines had to be capable of 100 Mbps. So, after getting all of my machines (3 at the time) upgraded to support 10/100 ethernet (the old off-brand PowerPC running Linux was the biggest challenge), I profiled transfers and realized that the best this repeater hub could achieve was about 3.6 MBytes/s. For a long time after that, I just assumed that was the upper limit of what a 100 Mbps network could achieve. Obviously, I now know that the upper limit ought to be around 11.2 MBytes/s and if I had gamed out that fact in advance, I would have realized it didn’t make sense to care about super-fast (for the time) disk performance.
At this time, I was doing a lot for development for MPlayer/xine/FFmpeg. I stored all of my multimedia material on this NAS. I remember being confused when I was working with Y4M data, which is raw frames, which is lots of data. xine, which employed a pre-buffering strategy, would play fine for a few seconds and then stutter. Eventually, I reasoned out that the files I was working with had a data rate about twice what my awful repeater hub supported, which is probably the first time I came to really understand and respect streaming speeds and their implications for multimedia playback.
Smaller Solutions
For a period, I didn’t have a NAS. Then I got an Apple AirPort Extreme, which I noticed had a USB port. So I bought a dual drive brick to plug into it and used that for a time. Later (2009), I had this thing called the MSI Wind Nettop which is the only PC I’ve ever seen that can use a CompactFlash (CF) card for a boot drive. So I did just that, and installed a large drive so it could function as a NAS, as well as a headless dev box. I’m still amazed at what a low-power I/O beast this thing is, at least when compared to all the ARM SoCs I have tried in the intervening 1.5 decades. I’ve had spinning hard drives in this thing that could read at 160 MBytes/s (‘dd’ method) and have no trouble saturating the gigabit link at 112 MBytes/s, all with its early Intel Atom CPU.Around 2015, I wanted a more capable headless dev box and discovered Intel’s line of NUCs. I got one of the fat models that can hold a conventional 2.5″ spinning drive in addition to the M.2 SATA SSD and I was off and running. That served me fine for a few years, until I got into the ARM SBC scene. One major limitation here is that 2.5″ drives aren’t available in nearly the capacities that make a NAS solution attractive.
Current Solution
My current NAS solution, chronicled in my last SBC post– the ODroid-HC2, which is a highly compact ARM SoC with an integrated USB3-SATA bridge so that a SATA drive can be connected directly to it :

ODROID-HC2 NAS
I tend to be weirdly proficient at recalling dates, so I’m surprised that I can’t recall when I ordered this and put it into service. But I’m pretty sure it was circa 2018. It’s only equipped with an 8 TB drive now, but I seem to recall that it started out with only a 4 TB drive. I think I upgraded to the 8 TB drive early in the pandemic in 2020, when ISPs were implementing temporary data cap amnesty and I was doing what a r/DataHoarder does.
The HC2 has served me well, even though it has a number of shortcomings for a hardware set chartered for NAS :
- While it has a gigabit ethernet port, it’s documented that it never really exceeds about 70 MBytes/s, due to the SoC’s limitations
- The specific ARM chip (Samsung Exynos 5422 ; more than a decade old as of this writing) lacks cryptography instructions, slowing down encryption if that’s your thing (e.g., LUKS)
- While the SoC supports USB3, that block is tied up for the SATA interface ; the remaining USB port is only capable of USB2 speeds
- 32-bit ARM, which prevented me from running certain bits of software I wanted to try (like Minio)
- Only 1 drive, so no possibility for RAID (again, if that’s your thing)
I also love to brag on the HC2’s power usage : I once profiled the unit for a month using a Kill-A-Watt and under normal usage (with the drive spinning only when in active use). The unit consumed 4.5 kWh… in an entire month.
New Solution
Enter the ODroid-HC4 (I purchased mine from Ameridroid but Hardkernel works with numerous distributors) :

ODroid-HC4 with an SSD and a conventional drive
I ordered this earlier in the year and after many months of procrastinating and obsessing over the best approach to take with its general usage, I finally have it in service as my new NAS. Comparing point by point with the HC2 :
- The gigabit ethernet runs at full speed (though a few things on my network run at 2.5 GbE now, so I guess I’ll always be behind)
- The ARM chip (Amlogic S905X3) has AES cryptography acceleration and handles all the LUKS stuff without breaking a sweat ; “cryptsetup benchmark” reports between 500-600 MBytes/s on all the AES variants
- The USB port is still only USB2, so no improvement there
- 64-bit ARM, which means I can run Minio to simulate block storage in a local dev environment for some larger projects I would like to undertake
- Supports 2 drives, if RAID is your thing
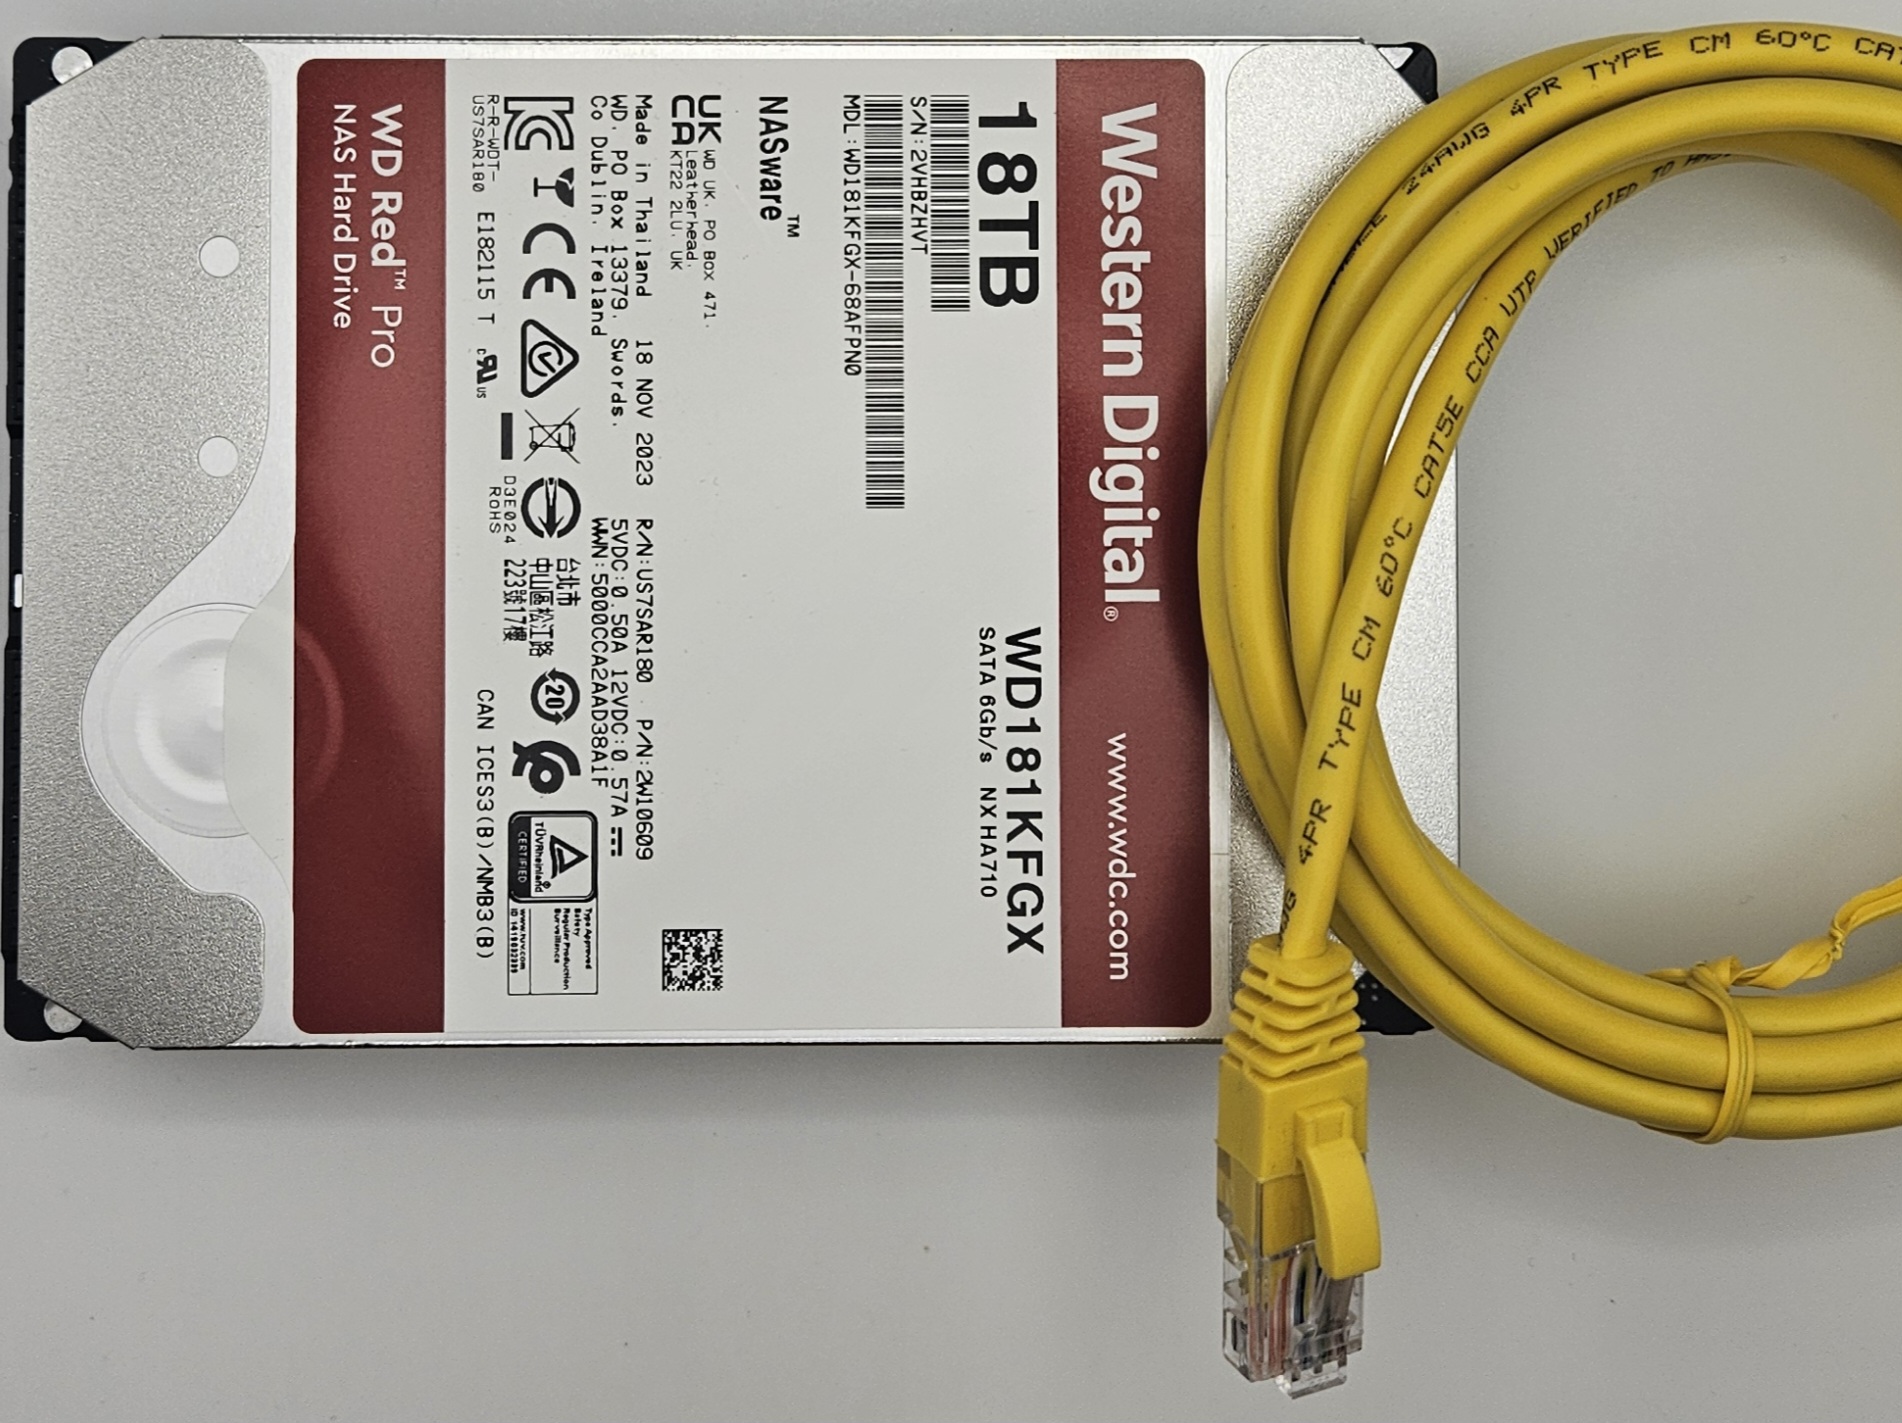
How I Set It Up
How to set up the drive configuration ? As should be apparent from the photo above, I elected for an SSD (500 GB) for speed, paired with a conventional spinning HDD (18 TB) for sheer capacity. I’m not particularly trusting of RAID. I’ve watched it fail too many times, on systems that I don’t even manage, not to mention that aforementioned RAID brick that I had attached to the Apple AirPort Extreme.I had long been planning to use bcache, the block caching interface for Linux, which can use the SSD as a speedy cache in front of the more capacious disk. There is also LVM cache, which is supposed to achieve something similar. And then I had to evaluate the trade-offs in whether I wanted write-back, write-through, or write-around configurations.
This was all predicated on the assumption that the spinning drive would not be able to saturate the gigabit connection. When I got around to setting up the hardware and trying some basic tests, I found that the conventional HDD had no trouble keeping up with the gigabit data rate, both reading and writing, somewhat obviating the need for SSD acceleration using any elaborate caching mechanisms.
Maybe that’s because I sprung for the WD Red Pro series this time, rather than the Red Plus ? I’m guessing that conventional drives do deteriorate over the years. I’ll find out.
For the operating system, I stuck with my newest favorite Linux distro : DietPi. While HardKernel (parent of ODroid) makes images for the HC units, I had also used DietPi for the HC2 for the past few years, as it tends to stay more up to date.
Then I rsync’d my data from HC2 -> HC4. It was only about 6.5 TB of total data but it took days as this WD Red Plus drive is only capable of reading at around 10 MBytes/s these days. Painful.
For file sharing, I’m pretty sure most normal folks have nice web UIs in their NAS boxes which allow them to easily configure and monitor the shares. I know there are such applications I could set up. But I’ve been doing this so long, I just do a bare bones setup through the terminal. I installed regular Samba and then brought over my smb.conf file from the HC2. 1 by 1, I tested that each of the old shares were activated on the new NAS and deactivated on the old NAS. I also set up a new share for the SSD. I guess that will just serve as a fast I/O scratch space on the NAS.
The conventional drive spins up and down. That’s annoying when I’m actively working on something but manage not to hit the drive for like 5 minutes and then an application blocks while the drive wakes up. I suppose I could set it up so that it is always running. However, I micro-manage this with a custom bash script I wrote a long time ago which logs into the NAS and runs the “date” command every 2 minutes, appending the output to a file. As a bonus, it also prints data rate up/down stats every 5 seconds. The spinning file (“nas-main/zz-keep-spinning/keep-spinning.txt”) has never been cleared and has nearly a quarter million lines. I suppose that implies that it has kept the drive spinning for 1/2 million minutes which works out to around 347 total days. I should compare that against the drive’s SMART stats, if I can remember how. The earliest timestamp in the file is from March 2018, so I know the HC2 NAS has been in service at least that long.
For tasks, vintage cron still does everything I could need. In this case, that means reaching out to websites (like this one) and automatically backing up static files.
I also have to have a special script for starting up. Fortunately, I was able to bring this over from the HC2 and tweak it. The data disks (though not boot disk) are encrypted. Those need to be unlocked and only then is it safe for the Samba and Minio services to start up. So one script does all that heavy lifting in the rare case of a reboot (this is the type of system that’s well worth having on a reliable UPS).
Further Work
I need to figure out how to use the OLED display on the NAS, and how to make it show something more useful than the current time and date, which is what it does in its default configuration with HardKernel’s own Linux distro. With DietPi, it does nothing by default. I’m thinking it should be able to show the percent usage of each of the 2 drives, at a minimum.I also need to establish a more responsible backup regimen. I’m way too lazy about this. Fortunately, I reason that I can keep the original HC2 in service, repurposed to accept backups from the main NAS. Again, I’m sort of micro-managing this since a huge amount of data isn’t worth backing up (remember the whole DataHoarder bit), but the most important stuff will be shipped off.
The post Adventures In NAS first appeared on Breaking Eggs And Making Omelettes.